What would be really interesting to see is what Ath shows for the power response, on-axis pressure response and on-axis directivity index of a circular piston in an infinite plane baffle.
I posted several years ago directivity index of flat circular piston in infinite baffle calculated using analytic vs BEM approach. DI was almost identical
https://www.diyaudio.com/community/...-design-the-easy-way-ath4.338806/post-6260913
Yes, in an IB case, when the rear polars are missing, I would have to subtract 3 dB to get a correct DI, I guess (i.e. always consider the full-space radiation as the reference). That however doesn't change in any way anything that has been said before.
Last edited:
VituixCAD is designing software with an optimizer so original PR per Olive's patent is quite...totally worthless. In addition, formulas documented in the patent application have some questionable features such as fixed slope sensitivity of SM and NBD, and DI sensitivity of LFX and LFQ assuming conventional omni LF, and average calculation is not clear. Discussion around the most worthless form of PR is quite excessive imo. It's just a method patent using one quantity: frequency response.VituixCAd also does a similar job https://kimmosaunisto.net/Software/Software.html but I believe that the author @kimmosto made some modifications to the metric.
VCAD users (should) primary use the last (custom) option which calculates using formulas, constraints and targets which are insensitive to slopes and DI level at LF, and valid for optimizing frequency responses with adjustable weighting for different speaker concepts.
^ Sorry, but what is "PR"? I can only think of "Passive Radiator" but then that doesn't make any sense.
PR= preference rating. It is some kind of statistical metric which is intended to assess how the "average" listener would rate the speaker under blind conditions.
I don't find it very useful.
I don't find it very useful.
Under blind conditions perhaps it has validity, but non-blind I doubt that it has much relevance.
Its a synthetic quality figure based on measurement data - so it's obviously "blind" as long as the metric don't include pictures of the product 🙂
//
//
I can see a use for such a thing, almost a necessity at a company like Harman. A "quality" metric is very important even if it is less than reliable. One hopes that they keep working on it to improve it, but I know from Sean that they believe that it is highly accurate. I can't attest to that myself and I have always thought that Sean's and Floyd's position on dynamics (which to me includes nonlinearity and diffraction ) as being not relevant was a little short sighted.
I posted several years ago directivity index of flat circular piston in infinite baffle calculated using analytic vs BEM approach. DI was almost identical
https://www.diyaudio.com/community/...-design-the-easy-way-ath4.338806/post-6260913
Thanks for the link. The results you show are further confirmation that the Hornresp DI calculations are correct (and that the Hornresp DI chart results are consistent with those generated using BEM techniques).
But these techniques are nowhere near as accurate as the BEM ones that Marcel uses.
It would seem that Hornresp is more accurate when it comes to generating a DI chart, though.
I would have to subtract 3 dB to get a correct DI, I guess
To get the correct half space DI you would need to add 3 dB to the Ath chart results, not subtract it.
That however doesn't change in any way anything that has been said before.
I think that it does.
You continued to insist that the DI was equal to the pressure response minus the power response:
DI is not an "inverse of the equalized Sound Power" but a difference between a selected SPL curve and the SP curve, again no matter what is the EQ, if any.
...and now if you want to calculate a DI for any polar (SPL) response, simply subtract SP from it.
Then you have at least one of those wrong.
Directivity index is the difference between a pressure response and the power response (both as SPL curves). If your tools show otherwise (as you say), there must be an error.
It has now been shown quite convincingly that this only applies to 4 x Pi free space conditions.
In Post #12,148 you stated that I did not understand what was being discussed and then went on to explain in some detail how the directivity index is determined:
To all who still haven't get what we are talking about (David McBean being obviously one of them):
Measuring SPL responses on a (spherical) surface around the source is a method of estimating its total radiated power (which we need e.g. for DI calculation).
What you failed to realise was that if the calculations are done for other than free space conditions, the DI will not be as shown in your Ath results. It would seem that it was you rather than me who did not understand.
I obviously meant the power response curve. Perhaps you should think more carefully about what I write, as you still seem to get much of it wrong. The DI is then (still) a mere difference between a chosen SPL curve and the power response curve, and this works for 4 x Pi and 2 x Pi as well. Nothing has been shown otherwise, only that I need to fix (simplify, actually) my code that calculates the weights of the areas to give the expected numbers in all cases, including an infinite baffle. Then it will give always the correct results.To get the correct half space DI you would need to add 3 dB to the Ath chart results, not subtract it.
To make it short: I don't agree with any of your conclusions in #12,211. I could take one by one but I'm already bored by this "discussion".
- And the last thing: This has nothing to do with CEA-2034 (which is an independent implementation) or any Harman quality metric. This was all about the understanding and use of the term "power response" per se. I use it exactly the same way as e.g. Earl does in his presentations (http://www.gedlee.com/Loudspeakers/NS15.aspx). If anyone has still a problem with that, I can't provide any more help than to explain how it's calcualted and what it means, which I did.
Last edited:
Back home from the Middle East with a fresh mind 🙂
"BEE" is just an experiment, separate from anything else. When defined, it generates a rounded LF-source enclosure with an (optional) opening for side radiation. There's no way at the moment to make a square top/bottom.
Someone told me once that when I show "A" (a free-standing waveguide), I should also show "B" (i.e. the rest of the system), so "bee" is really just a "B"...
Is there a way to make the BEE enclosure have a square top/bottom rather than a radius? I'm also a confused about the BEE enclosure. Is it a special case of Mesh.Enclosure Marcel wrote as an experiment on passive cardioid or something else? Also, I feel dumb. What does BEE mean, Baffle Enclosure Experiment was all my itsy-bitsy brain could come up with.
"BEE" is just an experiment, separate from anything else. When defined, it generates a rounded LF-source enclosure with an (optional) opening for side radiation. There's no way at the moment to make a square top/bottom.
Someone told me once that when I show "A" (a free-standing waveguide), I should also show "B" (i.e. the rest of the system), so "bee" is really just a "B"...
The thing is that as long as this deviation is in level only, it can actually be a good thing - I assume you're familiar with the toe-in delay/level trade-off concept. But I've never thought much of the shape of the off-axis level gradient itself - I always intuitively assumed that there's not much that can be done about it (other than changing the nominal beamwidth). It would be interesting if you could simulate some devices with different gradients. I don't have a clue how would I try to do that...[...] With an approximation closer to the gradient beam, which is closer to actual behaviour, there is a large deviation in listening window.
BTW, you could easily add a gnuplot report to Ath showing the gradient in the same way as you did.
Last edited:
All the examples I gave were perfect CD bc it would be a pain to try and make a non-CD version, so in an imperfect or non-CD case it is not a simple deviation in level. I'm not sure what you mean by toe-in delay, is this delay of first reflections? And neither am I on level-tradeoff.The thing is that as long as this deviation is in level only, it can actually be a good thing - I assume you're familiar with the toe-in delay/level trade-off concept. But I've never thought much of the shape of the off-axis level gradient itself - I always intuitively assumed that there's not much that can be done about it (other than changing the nominal beamwidth). It would be interesting if you could simulate some devices with different gradients. I don't have a clue how would I try to do that
Yeah its likely very difficult to engineer the shape of the gradient, it would depend on the WG profile, but it may just be inherent in how the sound behaves.
It may be possible to do it using some kind of phased array of drivers, but it's not exactly analogous to a real speaker.
The lastest ath plot is quite close already 🙂BTW, you could easily add a gnuplot report showing the gradient in the same way as you did.
the trend would always be so that off-axis, 90 max in these default graphs, is always high at low frequency and slopes down toward high frequency due to sound wavelength changing, unless you make such big of a horn it can control the output down to very low frequency.Yeah its likely very difficult to engineer the shape of the gradient, it would depend on the WG profile, but it may just be inherent in how the sound behaves.
One can introduce some "widening" with diffraction, but it comes with narrowing so not sure if its something useful, its just ripple. Then we are limited to constant directivity for some bandwidth with less or more sloping DI, beaming. I think one could tailor some gradient for some bandwidth but the problem is from 20kHz and down. Here few examples, try to follow for example 40deg line on the two first images, dip around 1-3kHz and then some boost above. Compare to ST260 where it doesn't happen to an extent but is more balanced, like flat or smooth downward slope. The first two have much wider nominal directivity, but no matter what it is they always plunges off-axis 20kHz given the throat is 1". You could make the throat much smaller if you wish to extend the top, but it simultaneously cuts usable bandwidth from the bottom I think.
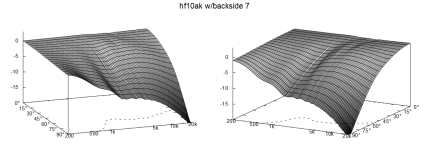
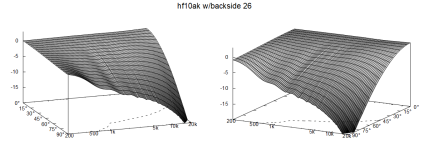
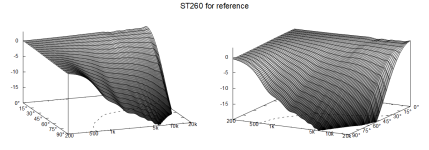
All these have the same big picture trend of course, wide response at low frequency and narrow response at high frequency and some behavior in between. If you look the graphs the difference is visible on the edge, on the 90deg line, also the 20kHz edge is nice to look at. I really like information on these graphs 🙂
So yeah I also think that basically all we can do is make sure the nominal directivity is wide enough to cater a practical listening window, especially at the highest frequency of interest. Reasonable target could be to have response within 1db for some bandwidth for a 3 person sofa, which is some degrees depending on distances and toe-in, width of the sofa. Basically it is quite close to the typical definition with +-30deg horizontal coverage so listening window within 1-2db or so up to some target frequency is reasonable.
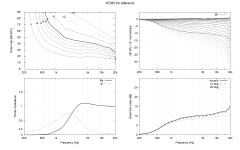
Here is measured normalized graph with ST260 which is reasonably constant directivity nominal 90deg device with 1" throat. It is roughly within 1db up to +-20deg. If you compare response of 1kHz to say 10kHz it is within 1db with itself up to +-40deg or so or how ever one likes to interpret the graph. This is of course few db:s down from on-axis SPL but every person within +-30deg listening window would get roughly the same frequency response above ~1kHz. In practice I would call this even response for a whole three person sofa, and beyond.
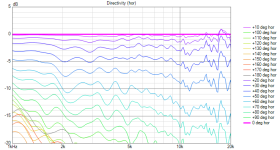
And of course its all visible in the standard ath raport as well, look the 1db controur line on the top left image.
...Preparing parts for the final printing. This is the idea:
The red parts in the second picture will make one piece, mounted to a driver. This assembly will be tightly inserted into the tube via a rubber gasket (also 3D printed). The whole left half of the tube will be filled and fastened with a threaded rod to a stand.
- As a reminder, this is the performance (note the power response curve 🙂):
Virtually no hint of diffractions, resonances or narrowing, with a DI as smooth as it can be.
Last edited:
As for the power response (the last comment) - I found an old simulation including a lumped-element model of a compression driver. Here's a power response shown both as absolute and using normalized data (the calculation doesn't care what's at the input). It's really only a different look at the same data. For the waveguide acoustic properties alone, this obviously doesn't matter at all -

- Home
- Loudspeakers
- Multi-Way
- Acoustic Horn Design – The Easy Way (Ath4)