There's really only a minor difference, your numbers leading (again) to a slightly more narrowing response. It really depends on what you are trying to achieve, I don't know of any universal and unique scale. You can generate hundreds of slightly different devices like this and there will be no meaninful way how to order them in terms of quality, IMHO.Do you see this design as an improvement over the ST260Wr3 based on whatever target you had in mind?
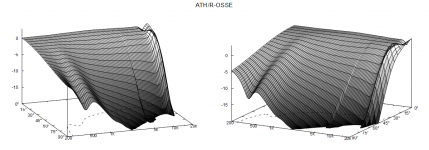
ST260Wr2 - the 220 mm version ("ST260Wr3"), the original vs maiky's:
Last edited:
Sure, that's how it works. 500 Hz should be already low enough not to worry much about details though.You mean the 18" (or 21") needs off-axis dispersion there to meet the horn's one for constant directivity around 500 hz?
18Sound ND4015Ti2, I'm going to give them a chance (I have a pair that I acquired fairly cheaply).which compression copes with 500 hz (B&C DE550) without too much stress ?
Last edited:
if you already in SB land why not go full throttle?
SB Audience Rosso-65CD-T Compression Driver-1.4"
No, JBL drivers are not readily available here and probably would be too expensive for what I need (I haven't done any real search though).Have you considered the JBL Dual Differential voice coil units?
I can buy most of the European PA brands locally, the SB line easily from France or Holland.
I don't need more compression drivers in the house 🙂if you already in SB land why not go full throttle?
I think you might need a way to overlay the results for comparison purpose, and maybe less than 30dB dynamic range for the DI graph. The r3 220mm still seems to have the bump in the 1dB contour though and maybe marginally rougher.There's really only a minor difference, your numbers leading (again) to a slightly more narrowing response. It really depends on what you are trying to achieve, I don't know of any universal and unique scale. You can generate hundreds of slightly different devices like this and there will be no meaninful way how to order them in terms of quality, IMHO.
ST260Wr2 - the 220 mm version ("ST260Wr3"), the original vs maiky's: View attachment 1126529
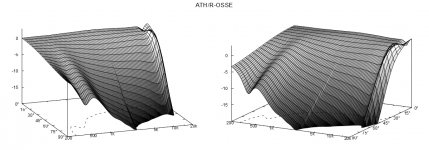
View attachment 1126530 View attachment 1126531
When compared to the 260mm version the optimized version looks better to my eyes, when compared to the 220 mm version it’s a lot closer but the point is the optimizer found that the most effective way was to decrease the diameter while improving smoothness. I’ll try to get an even wider pattern but if the goal is to have a flatter DI then it might come at the expense of near axis smoothness.
Another thing, what is the purpose of this W variant? If it is to pair with a smaller woofer having an indication on its diameter may be very helpful to match the directivity.
I do what I'm used to and that it to switch instantly back and forth between the pictures, that works perfectly for me, thanks.I think you might need a way to overlay the results for comparison purpose
Yes, to match to a smaller woofer like 7 - 10" perhaps, that's really not critical with these waveguides.Another thing, what is the purpose of this W variant? If it is to pair with a smaller woofer having an indication on its diameter may be very helpful to match the directivity.
The waveguide size (R) can be changed easily, virtually without affecting the smoothness. It just shifts most of the acoustic features lower or higher in frequency, including the point where the DI starts to fall. So this way it can be also "adjusted" to any particular woofer at hand.When compared to the 260mm version the optimized version looks better to my eyes, when compared to the 220 mm version it’s a lot closer but the point is the optimizer found that the most effective way was to decrease the diameter while improving smoothness.
Last edited:
;0)I don't need more compression drivers in the house 🙂
lol im ashamed i have 16 of a different brand sitting at home now looking for a new project..
Well, that -1dB contour bump also means it has a better controlled directivity. As I said, pick your poison (besides, I don't see it as rougher). I don't know what's better - there's simpy no metric for that.The r3 220mm still seems to have the bump in the 1dB contour though and maybe marginally rougher.
Last edited:
I give your tweeter id to Greta Thumberg....;0)
lol im ashamed i have 16 of a different brand sitting at home now looking for a new project..
That's a bit too much credit. I just try to make the lines in the report of ath smooth/equidistant. That means smooth DI and that seems to make @mabat happy. When he is happy, I am happy.With an optimizer (or without), there is no reason NOT to try to get both the LW (or 10deg) AND the ON as smooth as possible, I suspect that Tom is doing that.
However, I have been thinking and reading a bit more...
The 'fall' plots make ripples more visible. @tmuikku made me think about diffraction with his remarks that seem to have been triggered by the fall plots.
I've reread some stuff by Gedlee (and it will take quite some more to really make sense of it) and my interpretation of that is that diffraction cause HOM and that that is quite audible.Does it really make sense to trade what looks like maybe 0.25 dB of ripple for a lumpier low end response?
The small ripples itself (0.25 dB) are not the problem. However, I find it likely that they are caused by some diffraction somewhere (e.g. the waveguide edge) and the diffraction causes an early reflection and that is the problem.
http://www.gedlee.com/Papers/Philosophy.pdfHistorically, CD was accomplished in a horn by using diffraction – a significant source of HOM. A narrow slit in the device forces the sound waves to diffract into a wide coverage angle which is then controlled with a basically straight sided horn. The downside of this approach is that the diffraction causes two problems. The first is the refection of energy from the diffraction slit back down the horn, which creates a standing wave resonance and its associated coloration and the second is the the substantial amount of HOM that are created.
So why are HOM so bad? It’s because they travel a path down the body of the device that is longer than the direct path. In essence HOM are a form of very very early reflections. The ear effectively masks problems in the frequency domain (as MP3 techniques can attest) but it does not mask as well in the time domain. It is very sensitive to these internal diffractions and HOM and they are quite perceptible. The rise in this perception with level is what makes the horn sound like it is distorting nonlinearly. The HOM are in fact the reason that horns have their poor sonic reputation.
So how is the HOM problem solved in the Geddes Loudspeaker designs? This is done in two ways. The first is to design a waveguide (using Dr. Geddes theories) that has a minimum of HOM to begin with. Dr. Geddes has proven that all contours generate HOM, but some more than others. For an axi-symmetric device, the Oblate Spheriodal (OS) waveguide can be shown to be the contour that generates the least amount of HOM, although HOM do still exist even in an OS waveguide.
If the ripples were caused by diffraction at the edge, the frequency at which they would occur would depend on the distance of the 'microphone' in the simulation (because of Pythagoras). Indeed they do (for a pseudo-random waveguide):


Also note that the level of fall-off is dependent on the distance. I think this has to do with the relative size of the waveguide wrt the listening distance (and again Pythogaros).
I think we would have to minimize the ripples to minimize the 'reflection' and then use some other mechanism to control the sound around the backside of the waveguide, e.g. tmax>1 and some absorption? Now I think of it, although the sound around the backside has never been reflected, it is a delayed version of the direct sound; which is what a reflection is also. So do we actually have to absorb that sound to limit the time domain problem? It might be low enough in frequency that our ears/brain cannot process it that fast (
Does this make any sense?
Our studies showed that this type of diffraction/HOM is highly audible - meaning that it's presence can be detected at a statistically significant level. But more importantly, to me, is the fact that this audibility increases with increasing SPL. That makes it almost indistinguishable from what we think of as nonlinear distortion.I've reread some stuff by Gedlee (and it will take quite some more to really make sense of it) and my interpretation of that is that diffraction cause HOM and that that is quite audible.
The small ripples itself (0.25 dB) are not the problem. However, I find it likely that they are caused by some diffraction somewhere (e.g. the waveguide edge) and the diffraction causes an early reflection and that is the problem.
This means that at some SPL even a .25 dB ripple would be audible. Hard to put actual numbers to it because it is so highly variable, but I think that it is always something to consider.
Forgive me if I misunderstood the discussion, I was gone for a week and didn't keep up with all the reading.
I have found that all objects nearby the speaker that reflect/diffract the sound will cause audible issues. Sometimes this is the loudspeaker itself and sometimes a components cabinet, or say the back wall. Certainly the side walls. As much as we can do to minimize these very early aberrations to the sound the better.So do we actually have to absorb that sound to limit the time domain problem?
How these aberrations get integrated into our sound perception gets very complicated. This is because the ear, as a filter system (know as gammatones,) have impulse responses that vary in length with frequency - short at HFs long at LFs. AT HF we can detect the direct sound very quickly. Anything arriving after that gets heard as a secondary reflection. AT LFs a very low time average happens, such that at VLFs we can sense the steady state - everything integrated all together.
I respectfully disagree.Well, that -1dB contour bump also means it has a better controlled directivity. As I said, pick your poison (besides, I don't see it as rougher). I don't know what's better - there's simpy no metric for that.
I am not saying that these are the only/best metrics, nor that there is no metric that would yield different results...
Here are some examples written in Octave/Matlab language:
Code:
    ON_LW_freq_index_high      = find( Data.Freq <= 12000,1, "last");
    ON_LW_freq_index_low       = find( Data.Freq <= 1300,1, "last");
    ON_LW_Diff                 = Data.LW - Data.LW(find(Data.Freq >= 1700, 1)) - ( Data.ON - Data.ON(find(Data.Freq >= 1700, 1)) );

    cost_ON_LW                 = sum( abs( ON_LW_Diff(ON_LW_freq_index_low:ON_LW_freq_index_high) ) ); % smoothness estimator, LMS to 0dB
    cost_ON_LW_std             = std(ON_LW_Diff(ON_LW_freq_index_low:ON_LW_freq_index_high)); % smoothness estimator, the curve is within +/-3*std 99.7% confidence interval

    [P, S, Mu]                 = polyfit( log(  Data.Freq(ON_LW_freq_index_low:ON_LW_freq_index_high) ),...
                                          ON_LW_Diff(ON_LW_freq_index_low:ON_LW_freq_index_high), 1 ); % Linear fitting
    RegressionONLW             = polyval( P, log( Data.Freq(ON_LW_freq_index_low:ON_LW_freq_index_high) ), S, Mu );
    ONLW_Smoothness            = 1 - (S.normr / norm( ON_LW_Diff - mean( ON_LW_Diff ) ))^2 % R^2 coefficient of determination [0:1], smoothness estimator, used by Olive in the Preference Rating paper
One can apply similar metrics for any curve, ON alone, LW alone, -ndB contours etc.
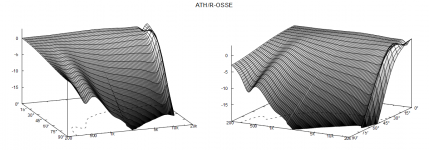
Assuming you used 110mm (a bit more or less does not change the relative results) for the smaller WG:
St220Wr3
cost_ON_LW = 4.4898 lower the smoother
cost_ON_LW_std = 0.1574 lower the smoother
ONLW_Smoothness = 0.8061 the higher the smoother
Optimized
cost_ON_LW = 3.4080 lower the smoother
cost_ON_LW_std = 0.1462 lower the smoother
ONLW_Smoothness = 0.9020 the higher the smoother
On this example the results are showing that the optimized version is smoother.
As to why I am focusing on the LW/On, this is because the LW flatness/smoothness is the single most correlated with high preference rating.
A more general remark: you have been advocating for smoothness as paramount and design the DI to be gently rising why has this WG different targets?
ST220Wr3(?) vs optimized small:
Last edited:
Some things to bear in mind and keep some perspective. Simulations like these are always more pessimistic about sources of diffraction than occur in reality. Nothing you physically make will have such a completely reflective boundary as the simulation enforces. There are potentially many other other small sources of diffraction not being modeled. A circular symmetry model with high mesh frequencies allows you to see things a full 3D simulation would not reveal. Does that mean it is more accurate or that more is being asked than can reasonably be expected.I've reread some stuff by Gedlee (and it will take quite some more to really make sense of it) and my interpretation of that is that diffraction cause HOM and that that is quite audible.
The small ripples itself (0.25 dB) are not the problem. However, I find it likely that they are caused by some diffraction somewhere (e.g. the waveguide edge) and the diffraction causes an early reflection and that is the problem.
Measuring this sort of anomaly in reality will be hard as every other form of diffraction in the test setup will have to be eliminated.
The diffraction from that edge is lower than I have seen from any real waveguide. Getting rid of it in simulation did not come for free and made something else worse, something that may actually be more audible or detrimental to the sound.
I do not want to discourage anyone from attempting to make something better if only just a little bit, but just to keep reality in mind when analysing simulated graphs with the microscope out.
I just don't see a reason why even a 21" should have a difficulty reproducing 500 Hz accurately. A would like to hear some technical argument.
I owned Gedlee Summas for about seven years. The only issue that I had, with the use of a 15" playing to 700Hz, is that the vertical beamwidth is really narrow. You have to be really careful with the setup, so that you don't wind up in a situation where's you're listening at a spot where a null is.
If you're using passive crossovers, this can be especially tricky. Even a delay of a fraction of a millisecond at the crossover point can tilt the lobes up or down.
Basically, the problem isn't using a 15" woofer for a midrange, the problem is getting the crossover right.
No, the idea behind the ring insert is to use a waveguide that starts as deep into the driver as possible and continues without any extensions, i.e. the ring part is actually a part of this waveguide.
See this Desmos graph - https://www.desmos.com/calculator/xokkqpqu9h
Set r_D0, r_D1, l_D (all the way down in the list) for a specific driver and then simply draw a waveguide that fits into the duct.
(Note that you can also set a0 < 0.)
What an interesting idea. Just cut out the bugscreen on the compression driver, and you can 3D print an optimal throat, instead of the conical one that comes with the compression driver.
That's why there's the parameter tmax, to help to eliminate the last bits of HF diffraction. Everyone is free to use it and also encouraged to do their best, whatever they think it is 🙂The small ripples itself (0.25 dB) are not the problem. However, I find it likely that they are caused by some diffraction somewhere (e.g. the waveguide edge) and the diffraction causes an early reflection and that is the problem.
(I, personally, don't like the looks of the shapes for tmax > 1 so I won't use it. I'm happy with 0.25 dB ripple.)
Among all the shapes I had at hand (including many similar to what you show as "optimized") I deliberately chose the one I chose to illustrate what's possible when aiming for as low and flat DI as possible. Seems it's not so easy to do, so I presented a starting point I found. Anyone can make any use of it if they want.A more general remark: you have been advocating for smoothness as paramount and design the DI to be gently rising why has this WG different targets?
- Home
- Loudspeakers
- Multi-Way
- Acoustic Horn Design – The Easy Way (Ath4)