The definition of "excess phase" in that article is different than the one that I am using, hence some confusion. To my knowledge there is no dictionary definition so I suppose that different definitions are possible. If anyone knows of a "dictionary" definition then please let me know as I will then need to change my terminology. Although I don't know what else to call it.
I am talking about the group delay (GD) that has the time-of-travel delay removed - which is irrelevant. When you see group delay curves with negative values then you know that some travel time has at least been partially removed. If the +- areas are about equal then the travel time has been maximally removed.
The "excess phase" in that article is the difference between the minimum phase group delay and the actual group delay - very different things.
My hypothesis is that the integration of my "excess GD" magnitude squared could be a strong indication of perception. Many things will affect this, but problems in a waveguide may not be wholly correctable with EQ as they can be in other situations. This could make for a Figure of Merit for a design along with frequency and power responses.
In this article, Pat Brown seems to approach excess (group) delay in a similar way.
"When analyzing the response of a component, it is useful to remove the pure delay between the stimulus and response, leaving only the excess delay due to filters, etc. The amount of pure delay to remove can be determined from observing the impulse response in the time domain or the group delay response in the frequency domain. Either can be used to get close enough to “fine tune” looking at a phase vs. frequency plot, which is the most resolute way of observing the residual delay. The stimulus can be delayed (usually within the analysis program itself) to yield the least slope in the phase response.
The group delay and phase response plots can be used together to characterize the total delay of the signal through a system. The group delay plot can identify the amount of pure delay that must be removed to leave the excess delay, which is usually viewed as a phase response.
Of course the impulse response in the time domain can also be used to characterize the pure delay. This requires an inverse FFT to change domains, where as the group delay plot does not.
Group delay is relative to the delay setting of the analyzer, so negative values (impossible in absolute time) are possible. It can be thought of as a simplified and lower resolution representation of the phase response. In the same way, a positive sloped phase curve implies a time reference that trails the signal. Such a relationship is said to be acausal and can never exist in absolute time."
Last edited:
There's no point in examining something that will get corrected automatically along with the correction of the magnitude response (via a simple minimum phase EQ).
What one should be interested in is the part of the delay that won't get corrected that way. Whatever we call it, it is the difference between the minimum phase and the actual phase (or the respective group delays, those are just derivatives of the phases). It can be compensated for the propagation (pure) delay, or not, that doesn't really matter as a pure delay is easily recognizable, especially in a GD plot.
What one should be interested in is the part of the delay that won't get corrected that way. Whatever we call it, it is the difference between the minimum phase and the actual phase (or the respective group delays, those are just derivatives of the phases). It can be compensated for the propagation (pure) delay, or not, that doesn't really matter as a pure delay is easily recognizable, especially in a GD plot.
Last edited:
To have some fun and to encourage people to actually try a free standing waveguide, I decided to release my first "serious" design of this type (was already measured here some time ago with several drivers).
It is called ST260 (ST = Small Teaser), cca ⌀260 mm x 83 mm.
Throat entry angle is 19° and should work well with majority of 1" drivers.
STEP and STL files of the ready-to-print waveguide available: https://at-horns.eu/release/ST260.zip
Have fun and give us a feedback! 🙂
So one could double all dimensions and get a waveguide for a 2" throat?
Sure, all the properties would just shift down in frequency in the same proportion. (Which may not be quite what you would want, however.)
Last edited:
There's no point in examining something that will get corrected automatically along with the correction of the magnitude response (via a simple minimum phase EQ).
What one should be interested in is the part of the delay that won't get corrected that way. Whatever we call it, it is the difference between the minimum phase and the actual phase (or the respective group delays, those are just derivatives of the phases). It can be compensated for the propagation (pure) delay, or not, that doesn't really matter as a pure delay is easily recognizable, especially in a GD plot.
This is my understanding too.
The interesting parts are those that cannot be compensated for by minimum phase EQ, or pure delay. And are the real trouble parts begging for correction.
Some trouble part examples are IIR crossovers above 1st order, multiple drivers producing same freq, level dependent resonances.
But true minimum phase aberrations are no problem at all ime/imo, other than decided how to EQ them

For years I’ve just been assuming what raw vs normalized is. But could someone please give me an actual explanation? I did a search of the forum but didn’t find one.
RAW: what a mic sees.
Norm: equal to after intense equalisation to make the on axis as flat as possible and the following effect on the off axis response. It's a theoretical exercise but should be approx. possible to obtain in reality.
//
Norm: equal to after intense equalisation to make the on axis as flat as possible and the following effect on the off axis response. It's a theoretical exercise but should be approx. possible to obtain in reality.
//
Yes, "raw" si what you get for a constant input voltage. Normalized is basically off-axis relative to the on-axis (as it's typically used) - that's not theoretical, that's also the reality.
I'm not so sure its the dominating way used. I suppose many listen to horns un-EQed. But rate is increasing as DSP is getting more and more obtainable..
//
//
For years I’ve just been assuming what raw vs normalized is. But could someone please give me an actual explanation? I did a search of the forum but didn’t find one.
From VACS help "Normalization
Performs a division by the reference value or data-set"
Normalizing to on axis sets that as reference, 20 degrees uses that as reference. When the reference is divided by itself you get a flat line.
I'm talking about the data/plot, not a usage of the horn. No constant directivity waveguide can ever be used unequalized. That would sound awful. Some EQ is always part of the crossover, no matter if passive or active or via DSP. In fact, that's one of the most important things that a proper crossover does.I'm not so sure its the dominating way used. I suppose many listen to horns un-EQed. But rate is increasing as DSP is getting more and more obtainable..
//
Last edited:
The important point is that the normalized response stays the same no matter what EQ you apply or what driver you use. So it describes the basic and driver-independent behavior of the waveguide alone (the directivity and possible diffractions), and also shows what you would get if you EQed the on-axis flat (or whatever off-axis angle was choosen as the reference, e.g. the optimal listening axis).... Normalized is basically off-axis relative to the on-axis (as it's typically used) - that's not theoretical, that's also the reality.
Last edited:
I'm talking about the data/plot, not a usage of the horn...
Hmm, but what does "dominating way used" in the context mean? That was what puzzled me...
//
That the on-axis is the reference. Well, in my case it's often more like 10° - generally it's probably not a very good idea to use the exact on-axis curve but for a good waveguide this doesn't really matter much...
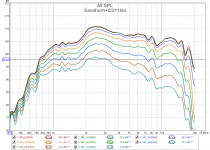
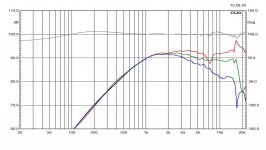
Sandhorn measured with Beyma CD11Nd, raw and normalized (courtesy of BV) -
Exit angle of the CD11Nd: 17.02º.
What's the throat angle of the Sandhorn?
Last edited:
No constant directivity waveguide can ever be used unequalized. That would sound awful.
This is true for compression drivers.
Some dome tweeters don't need eq when mounted behind a (shallow) waveguide.
In this article, Pat Brown seems to approach excess (group) delay in a similar way.
Thanks for that link. More and more SynAudCon is turning into my go-to site for practical audio science.
On that page you linked, was this link to a 1979 SynAudCon session with Dick Heyser. What a genius !!
Richard Heyser on TDS | Prosoundtraining
just finished the full 5hrs...
- Home
- Loudspeakers
- Multi-Way
- Acoustic Horn Design – The Easy Way (Ath4)