Then use the Grid Export options to generate XYZ data and import it into Solidworks with my Excel MacroI am using AutoCAD R14 and Solidworks.
Acoustic Horn Design – The Easy Way (Ath4)
Or use the inbuilt Curves from XYZ command and format the data to fit. I posted about that earlier in the thread but the Excel Macro is a lot easier for doing it many times.
Or download Fusion for free and use the .afp option in Ath and export to step or DXF from a sketch in Fusion for use in whatever software you prefer 🙂
Last edited:
Not bell but more like pottery. I'd like to perform some measurements where it would show up. Apparently these will be quite high Q resonances.
Perhaps it won't be so easy to excite them by the radiating sound from the waveguide itself, I don't know. That would be good news, I suppose.
Otherwise I'm pretty satisfied with the results so far.
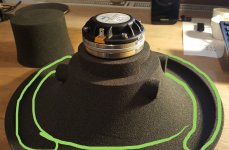
Perhaps a damping solution would be to fill the “trough” (see image) with a self-leveling polyurethane used for filling cracks in cement
Attachments
Hi fluid,
thank you, I will try the macro, this way I will not have to take the detour via Fusion.
Kindest regards,
M
thank you, I will try the macro, this way I will not have to take the detour via Fusion.
Kindest regards,
M
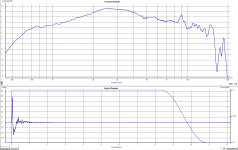
WG seem to disperse the same with 3 different CDs but one can see no common FR features between the different CDs so WG seem CD transparent which I suppose is really good. I can see no ringing in FR but these will rather be seen in impedance traces and/or in the time domain. Looks nice! I'd pick the Celestion and run it > 1,5k - probably ;-)
//
//
Not bell but more like pottery.
Earthenware or porcelain? 😉
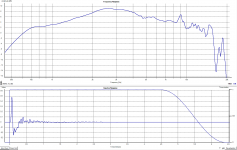
The measurements look good so far. I don't see any hint of ringing attributable to the waveguide, but high-Q stuff obviously won't show up very well with a short window. It may be useful to record the ringing (when tapping on the WG) to determine the frequency so you know where to look.
Thanks. I will work that up tomorrow AM. These are good without overlap but could well be better with. Otoh, no overlap allows 1" exit cd
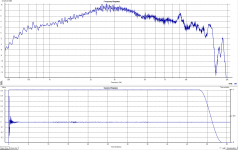
Earthenware. It's a multitude of frequecies between 0.7 and 5 kHz. Maybe a stepped sine distortion masurement with a very small frequency step would show the actual level of the problem (will try that today if the family leaves for a while). Otherwise it's not really visible in the FR even when you know where to look - at least I see nothing suspicious, other than the received reflections.Earthenware or porcelain? 😉
The measurements look good so far. I don't see any hint of ringing attributable to the waveguide, but high-Q stuff obviously won't show up very well with a short window. It may be useful to record the ringing (when tapping on the WG) to determine the frequency so you know where to look.
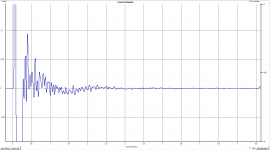
Below are FRs for three different time window lengths (5, 10, 50 ms). After 50 ms it doesn't change further. No smoothing.
Attachments
Last edited:
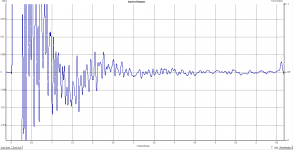
I don't see anything either. You might try a few measurements at around 90-120° azimuth (the same for each measurement) while rotating the waveguide about its axis of symmetry. The radiation of the waveguide itself at its resonances should, if I'm thinking about this correctly, resemble some kind of complex multipolar source and have a different radiation pattern for each resonance. A bell, for example, radiates like a lateral quadrupole at its fundamental resonance.
Last edited:
Actually, after thinking a bit more, I realized that the basic "bell mode" shouldn't be excited in this case, so my suggestion above may not be very useful.
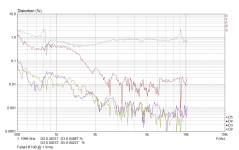
2nd is quite high. 3rd above 2,3k is amp territory - wow. How many dB SPL is 1m for 1v? Clean impedance is reassuring.
An other test would be to impose a real electrical step or pulse and record it. Because the from a sweep (steady state) derived pulse response is calculated and probably perfectly "true" for the small signal situation. But a real pulse has a lot of more instantaneous energy imposed into the system and therefore will trigger resonances more like in a real music reproduction situation.
//
I don't have it calibrated to the absolute but I guess it can be around 100 dB SPL in the middle of the band.
Well, minimizing the linear distortion, no doubt about that. Basically maximizing the performance in accordance with CEA-2034, as the necessary part. Anything above that is a nice bonus.
So far I'm not sure how to deal with something as damping of the waveguide - how to even assess the level of performance. When it's good enough?
So far I'm not sure how to deal with something as damping of the waveguide - how to even assess the level of performance. When it's good enough?
- Home
- Loudspeakers
- Multi-Way
- Acoustic Horn Design – The Easy Way (Ath4)