Once you realize how good can an axisymmetric curve actually be, there will be no way back. It's so much more elegant and so much easier to work with! Not to mention that the simulation takes a fraction of the time. I would have never come to the optimized freestanding waveguides without employing the CircSym mode. To be able to run a full hi-res simulation in a minute than an hour or two (or five) is a radical difference.
Do you use Ath to generate the Node values from the co-ordinate files and if so, does it output the backside of the freestanding waveguide co-ordinates somehow?
I was able to run bmc0's python directivity script on the output from VACS after a bit of renaming, the graphs are very nice and match the VACS polar so I think I did it correctly 🙂
Mabat's example script
Mabat's example script
Attachments

Yes, it does it all based on a definition file (to be published in some next release).Do you use Ath to generate the Node values from the co-ordinate files and if so, does it output the backside of the freestanding waveguide co-ordinates somehow?
BTW, you can save all the BEM results into a text file directly from ABEC ("Spectra - Export data as text") for a custom processing. I realized this only recently and this is how I process the data now - no need to use VACS at all.
Anything I want to do is always in the next release 😉Yes, it does it all based on a definition file (to be published in some next release).
Renaming the files from VACS to the required syntax for Vituix or bmc0's script seems easier to do for me as I have the renaming scripts set up already.BTW, you can save all the BEM results into a text file directly from ABEC ("Spectra - Export data as text") for a custom processing. I realized this only recently and this is how I process the data now - no need to use VACS at all.
If you skip through this guys videos I think there might be some shots of the kipple data:
Bennett Prescott - YouTube
(There are also lots of general comments about the differences in the newer drivers)
I watched the video there was some useful information in there and some background klippel images.
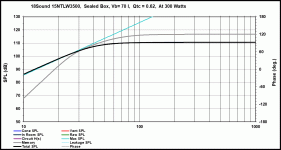
I ran some simulations of the 15NTLW3500, seemed good enough to enquire about the price and availability, bad news on both counts. Sealed with some EQ below.
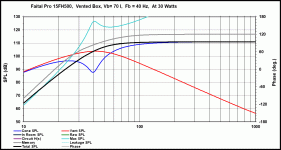
I've spent days running different woofers through and I quite like the look of the 15FH500. Many have parameters for very small boxes and long vents which don't seem to be a practical choice. 15FH500 seems quite flexible to all tunings. Grey line in both graphs is a vented 15TLW3500.
Attachments
Rather than continue with paralysis by analysis I just ordered the Faital 15FH500 drivers 😉
I have been experimenting with some axisymmetric curves and I like the idea of being able to change the directivity pattern in an otherwise similar device to see if I actually have a preference. I researched as much as I could find on ideal directivity and all of the recent discussion in your thread has been had before a few times with no real consensus then or now.
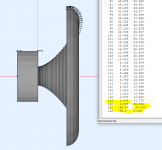
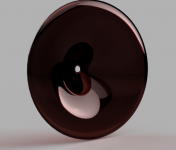
I have wasted some time recently rendering a freestanding guide after wrestling Rhino and Fusion to model one. If something like this could be made I think it is quite attractive.
Once you realize how good can an axisymmetric curve actually be, there will be no way back.
I have been experimenting with some axisymmetric curves and I like the idea of being able to change the directivity pattern in an otherwise similar device to see if I actually have a preference. I researched as much as I could find on ideal directivity and all of the recent discussion in your thread has been had before a few times with no real consensus then or now.
I have wasted some time recently rendering a freestanding guide after wrestling Rhino and Fusion to model one. If something like this could be made I think it is quite attractive.
Attachments
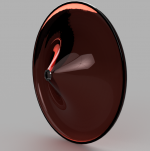

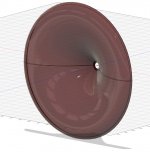
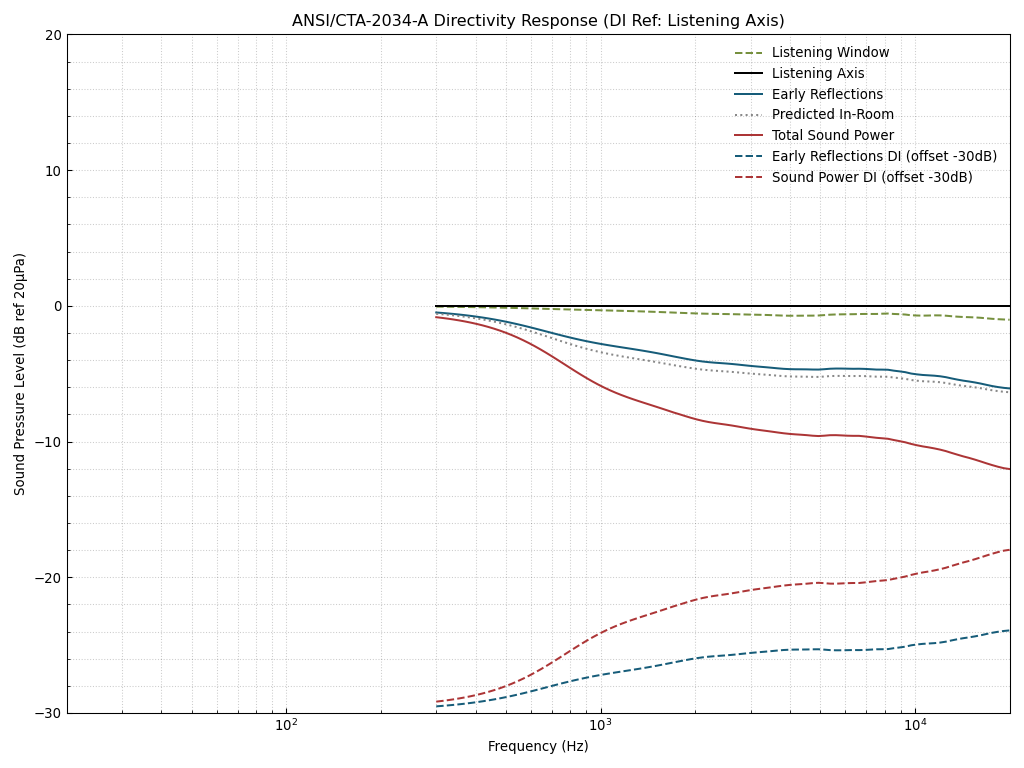
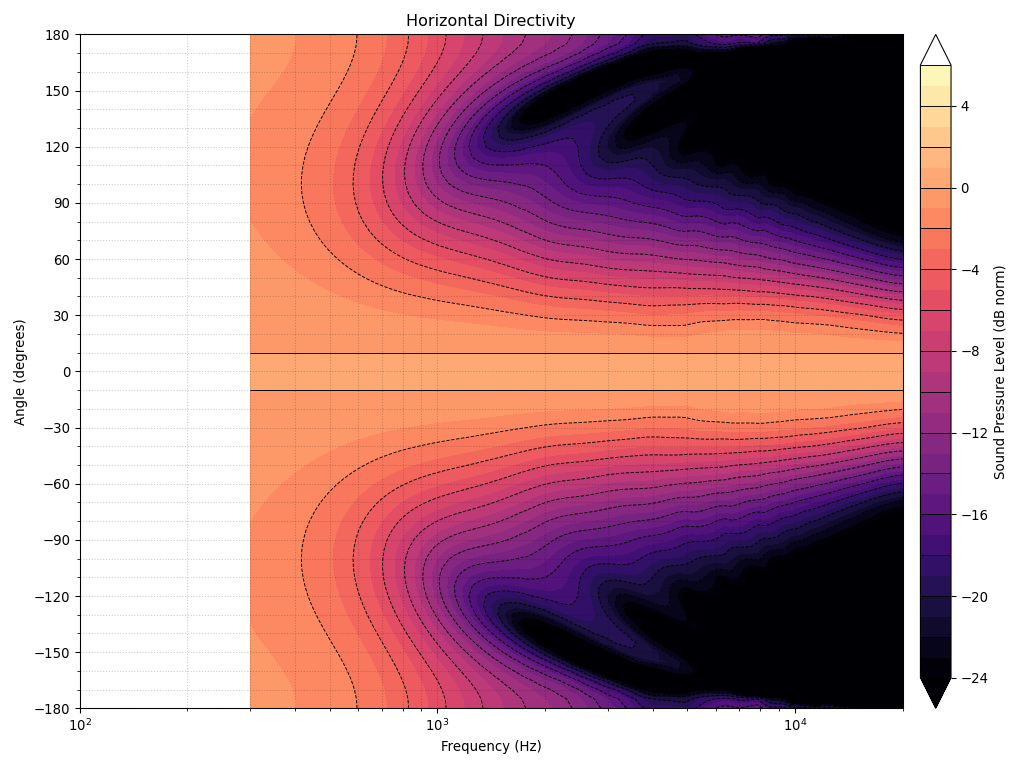
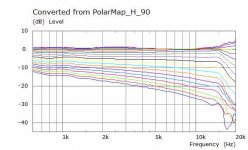
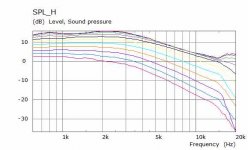
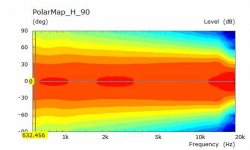
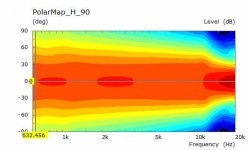
The renderings above were based on a curve from bmc0's waveguide script (which he was kind enough to let me use) an OS throat joined to a curvature matched Euler Spiral with a rollback of the same spiral. As has been discussed before there is a trade to be made between smoothness of response throughout to absolutely flat DI. This one has gradually increasing directivity but is more constant than the previous one I posted at 3dB / decade. You can see in the -90 to +90 Polar that there are some hot spots from the ripple in the response inside the normalization angle. They are quite minor and are the price to pay for a virtually constant response +30 to -30 otherwise.
Another interesting thing I found from using the script is it outputs a SVG (Scalable Vector) file with tags to describe the different parts of the horn, inner outer and diaphragm. ABEC can read this file instead of needing to specify the nodes in a text format. That could open open up options for drawing curves in image programs and simulating them.
Another interesting thing I found from using the script is it outputs a SVG (Scalable Vector) file with tags to describe the different parts of the horn, inner outer and diaphragm. ABEC can read this file instead of needing to specify the nodes in a text format. That could open open up options for drawing curves in image programs and simulating them.
Attachments
Well done. I think more and more waveguides will look like this in the time to come.
Thanks for the tip on using SVG. The ABEC manual mentions Inkscape that can add tags to the elements. This could be a convenient way to draw it including a whole phase plug, for example. Or a free standing woofer.
Thanks for the tip on using SVG. The ABEC manual mentions Inkscape that can add tags to the elements. This could be a convenient way to draw it including a whole phase plug, for example. Or a free standing woofer.
The SVG is actually a very cool way to do it. You get an instant look at the curve just as an image file.
bmc0's script outputs the SVG to the console which is then copied and pasted into a text file with the extension changed to .svg (at least that is how I did it)
This is an example diaphragm code
bmc0's script outputs the SVG to the console which is then copied and pasted into a text file with the extension changed to .svg (at least that is how I did it)
This is an example diaphragm code
Code:
<?xml version="1.0" standalone="no"?>
<!DOCTYPE svg PUBLIC "-//W3C//DTD SVG 1.1//EN" "http://www.w3.org/Graphics/SVG/1.1/DTD/svg11.dtd">
<svg width="293.2601269620923mm" height="297.57627021171277mm" viewBox="-10.0 0 293.2601269620923 297.57627021171277"
 xmlns="http://www.w3.org/2000/svg" version="1.1">
<path d="M 0 0
 L 0 1.7375
 L 0 3.475
 L 0 5.2125
 L 0 6.95
 L 0 8.6875
 L 0 10.425
 L 0 12.1625
 L 0 13.9
" fill="none" stroke="red" stroke-width="1" id="diaphragm" />
</svg>I suspect in the first instance I will make a non rolled back version in a rounded baffle that will end up looking much like the speaker bmc0 made except bigger.I think more and more waveguides will look like this in the time to come.
CNCing both sides of something like the freestanding guide above would be a pain due to the limited z height I will have unless it was made to be ugly on the back.
The advantage of SVG is that is can be easily modified manually in just any vector drawing tool that supports that format. Save back and use in the same simulation right away.
I suppose DXF could be used as well.
I suppose DXF could be used as well.
Last edited:
The render looks nice, as do the sims.
If you run the script from the command prompt, you can just redirect the output directly into the file:
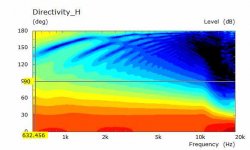
13.9mm seems like a strange value for the throat radius.
outputs the SVG to the console which is then copied and pasted into a text file
If you run the script from the command prompt, you can just redirect the output directly into the file:
Code:
command > file.svg13.9mm seems like a strange value for the throat radius.
Yes it would make experimentation fairly easy, according to the manual DXF needs to be a 2006 format but I'm sure it could be made to work too.The advantage of SVG is that is can be easily modified manually in just any vector drawing tool that supports that format. Save back and use in the same simulation right away.
I suppose DXF could be used as well.
Thanks 🙂The render looks nice, as do the sims.
If you run the script from the command prompt, you can just redirect the output directly into the file:
Code:command > file.svg
13.9mm seems like a strange value for the throat radius.
I'll give it a try I was just pleased I could get the script to run on windows.
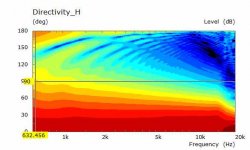
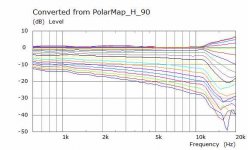
13.9 was a typo in the configuration file should have been 17.9 for the HF1440.
These are the graphs for the corrected throat radius for a HF1440
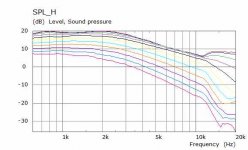
Very similar except the change in directivity at the top end happens lower in frequency as expected. Possibly slightly more even in the 2k to 10k region, seen better in the SPL graph but might be hard as the image is not very big here.
Very similar except the change in directivity at the top end happens lower in frequency as expected. Possibly slightly more even in the 2k to 10k region, seen better in the SPL graph but might be hard as the image is not very big here.
Attachments
- Home
- Loudspeakers
- Multi-Way
- 2 way waveguide speaker build ABEC modelling