For any OSX beginners - LTSPice will use up to 12 threads for simulation. Running a small time step multiple regulator model is using ~890% CPU on a 2018 Mac mini 6 core (+HT so let's call that 12 cores)! The Process application only seems to take about 182MB out of 32GB (it gets used for AI and quantum MCMC simulation).

The UI/UX us a bit arcane but once you download the OSX key map then it works quickly when in use plus it's fast.
The UI/UX us a bit arcane but once you download the OSX key map then it works quickly when in use plus it's fast.
Plotting Device Dissipation
Passing on a trick I learned the other day. If you hover over a device you'll see the dissipation in the status bar in the lower left corner. But this is the dissipation at the initial DC operating point. This can be misleading
If you run a transient simulation, you can hold down ALT key and hover over a device. The cursor will switch to a thermometer. If you click the device, it will plot the function used for calculating dissipation. From the plots, you can see peak dissipation. You can also hold CTRL and left click the trace formula to see the average dissipation.
Using this functionality, you can vary the input signal to find the peak average dissipation for a device. For a class AB amplifier, somewhere around 70% signal should be the peak.
As a example, using a simulation of the P3A amplifier with ±35 V rails, 75 mA of bias, a 1 kHz / 1 Vrms input and a 8Ω resistive load, the dissipation in the status bar shows as 2.6 W per output transistor. This is simply the dissipation at the initial operating point. Using transient analysis, I can see that the average dissipation is actually closer to 10.8 W with 36.9 W peaks.
Hi Guys
I am busy with a hotstart and antistick schematic simulation, however I need to start without load and after 1 second or such the load need to connect. It is a resistor who does simulate the electrode, a inverter does start always with open loop voltage and as such need to do that also in ltspice.
Without that I can not sim because it does not load the timer circuit cap.
Maybe a voltage source is usable in seconds setup, who does give 60 volts for 1 second and stops, that works also.
Maybe someone can help
Thanks.
Last edited:
Hello Kees
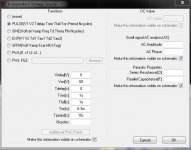
Have I understood correctly - that you want to have a virtual switch that closes after one second?
If so, is this what you mean? S1 is a voltage controlled switch which switches on at t=1s.
It's adapted from Vswitch.asc, which you can find in the educational folder of LTspice examples. Plot I(R1) to see its effect.
Attachments
Hello Kees
Have I understood correctly - that you want to have a virtual switch that closes after one second?
If so, is this what you mean? S1 is a voltage controlled switch which switches on at t=1s.
It's adapted from Vswitch.asc, which you can find in the educational folder of LTspice examples. Plot I(R1) to see its effect.
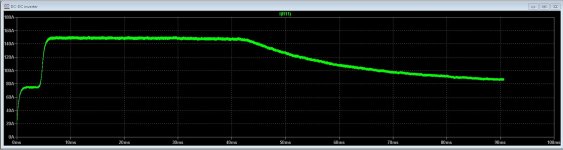
I have done it this way, a voltage source as pulse and set it on some seconds, or what I did now 6.3 seconds.
on pic two I see that is what I want a hotstart for the welding inverter I have, now I can go built it into the machine. Do forget the first 10 mS because thisd happen only in si,
real world start always with loaded capacitor 330u because of open output if I not weld..
This way it works fine, Thanks for the help.
regards
Attachments
Last edited:
? BC140 BC160 LTspice model
Hi!
I am looking for LTspice model data for the transistors BC140 + BC160.
Can somebody help me with it?
Hi!
I am looking for LTspice model data for the transistors BC140 + BC160.
Can somebody help me with it?
BC140 Spice model
catd,
DuckDuckGo was very good to me.
From it I found Spice Model Listing :: Central Semiconductor
From there, I entered "BC140", et voila!, a model appears.
I cannot vouch for its suitability; I only now downloaded LTSpice. 🙄
Unfortunately, the same cannot be said for "BC160"
Kind regards,
Drew
catd,
DuckDuckGo was very good to me.
From it I found Spice Model Listing :: Central Semiconductor
From there, I entered "BC140", et voila!, a model appears.
I cannot vouch for its suitability; I only now downloaded LTSpice. 🙄
Unfortunately, the same cannot be said for "BC160"
Kind regards,
Drew
Look at my collection of models:
For LTspice users. Libraries of models, examples, etc
file Standard.bjt in cmp.zip
For LTspice users. Libraries of models, examples, etc
file Standard.bjt in cmp.zip
Hi all
I have get the question about distortion of the amplifier, and then special the second between brackets figures, Someone say that is because of the higher harmonic content, like the switching frequentie present.
Is there a way to do it better and then let it stop around 100Khz or such so that the switching harmonics getting out of the simulation, that way I think it will be better to manage.
If someone now, I like to hear.
Thanks in advance.
kees
Attachments
Is there a way to do it better and then let it stop around 100Khz or such so that the switching harmonics getting out of the simulation...
Kees
Look at the structure of the .four command in the LTspice help file.
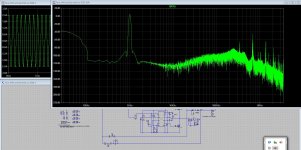
You can control the bandwidth of the measurement by stipulating the number of harmonics in the .four command. For example, if the frequency of the applied sine wave is 1kHz, and you want to measure THD up to 100kHz, then your command might be:
.four 1kHz 100 I(R12)
the number 100 stipulating that the calculation should be based on the first 100 harmonics. (Normally this would be 8-10 harmonics.)
It helps to get accurate results by forcing the Fourier analysis to be performed over a number of cycles greater than the default one cycle. Additionally, as long the simulation is performed over an exact number of cycles, then stipulating -1 as the number of cycles is a good idea, as it forces LTspice to perform the analysis over the entire simulation data range.
The command would now be:
.four 1kHz 100 -1 I(R12)
I've incorporated these improvements into the circuit we had discussed in the Class D Design Issues thread and reposted it here. The THD at 1kHz calculated with a bandwidth of 100kHz is around the 0.1% mark.
Attachments
Kees
Look at the structure of the .four command in the LTspice help file.
You can control the bandwidth of the measurement by stipulating the number of harmonics in the .four command. For example, if the frequency of the applied sine wave is 1kHz, and you want to measure THD up to 100kHz, then your command might be:
.four 1kHz 100 I(R12)
the number 100 stipulating that the calculation should be based on the first 100 harmonics. (Normally this would be 8-10 harmonics.)
It helps to get accurate results by forcing the Fourier analysis to be performed over a number of cycles greater than the default one cycle. Additionally, as long the simulation is performed over an exact number of cycles, then stipulating -1 as the number of cycles is a good idea, as it forces LTspice to perform the analysis over the entire simulation data range.
The command would now be:
.four 1kHz 100 -1 I(R12)
I've incorporated these improvements into the circuit we had discussed in the Class D Design Issues thread and reposted it here. The THD at 1kHz calculated with a bandwidth of 100kHz is around the 0.1% mark.
I discover the spice error log is grayed out, I did use your file. That was by the way longer the case, happen after a update, but now i need it, maybe I have set something wrong? I had never this problem did work always...
Thank you for the info and help, I set it up that way.
regards
Last edited:
Error log does work again, it is because I had put the plot files on a other disk and not default, then it will not work.
Oops...
Kees, apologies, there was a mistake in the file I posted in #1811. Here is the corrected version - to test at other frequencies all one has to do is change the line:
.param Frequency=xxx
Corrected file attached.
Kees, apologies, there was a mistake in the file I posted in #1811. Here is the corrected version - to test at other frequencies all one has to do is change the line:
.param Frequency=xxx
Corrected file attached.
Attachments
Last edited:
Does anybody have a model template for a center-tapped inductor or know how best to make one?
I built one using two inductors and the directive "K1 L1 L2 1" but the resulting model doesn't behave like a dual winding choke. Any suggestions for a way to create it? I'd like to model the Lundahl LL1685.
Thanks !
I built one using two inductors and the directive "K1 L1 L2 1" but the resulting model doesn't behave like a dual winding choke. Any suggestions for a way to create it? I'd like to model the Lundahl LL1685.
Thanks !
Kees, apologies, there was a mistake in the file I posted in #1811. Here is the corrected version - to test at other frequencies all one has to do is change the line:
.param Frequency=xxx
Corrected file attached.
Copy that. You have set to 100 harmonics? does stay that below the 100 Khz bandwidth? because I need only HD measurement below the swiching harmonics that is maybe the best not higher then 50 Khz. I have also multilevel class D who goes to 1.8 Mhz carrier.
The way you use LT spice is professional, I am unfortanely not that educated there, I use the slow approach most of the time, but I do use yours to see what to learn, what is done with dead time? because there is crossover between de transitions of the three level.
Thanks for your help..
You have set to 100 harmonics? does stay that below the 100 Khz bandwidth? because I need only HD measurement below the swiching harmonics that is maybe the best not higher then 50 Khz.
Hi Kees. The point about setting .four to operate with 100 harmonics is simply that the frequency of the 100th harmonic, with a 1 kHz fundamental, is 100 kHz, and you had asked how to do a Fourier analysis with a B/W of 100 kHz.
If you want a B/W of 50 kHz and your test frequency is 1 kHz, then clearly you should set the analysis to cover 50 harmonics.
I did also see I use current I measure on output, is Volt not better to do?.
A Fourier analysis of the voltage is certainly the usual way to do it. I had done it with current through the load because your original circuit did this and I assumed there was a reason for your doing it this way.
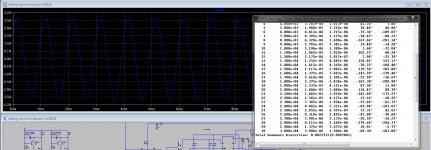
I've attached your file again with an additional Fourier analysis of the voltage across the load. Note that the current and voltage waveforms are exactly in phase, and that the results of the two .four analyses are identical, which is exactly what one would expect with a resistive load.
As an aside, it is interesting to see what happens if one substitutes a loudspeaker equivalent circuit for the resistive load in the simulation, and I have done this in the zipped folder. The two analyses now have different results, the current and voltage waveforms are not aligned in time, and the question arises: which result more accurately reflects what we actually hear?
The results are: THD_voltage = 0.068%; THD_current = 0.26%.
This question arose in a recent thread in the Tubes forum, "Do tubes actually sound like anything?", especially from post #152 onwards. But I didn't dare go near that thread...
Attachments
- Home
- Design & Build
- Software Tools
- Installing and using LTspice IV (now including LTXVII), From beginner to advanced