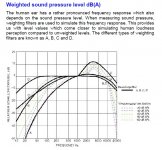
For noise I can understand the need for weighting but not for distortion.
My objection is pointed at marketing. I've found cases where A weighting was used in brochures but not stated making the specs look better than other products. That's cheating.
Yes, those marketing folks do cheat - on lots of things - like specifying THD at 1kHz only.
And these aren't even the snake-oil folks.
Cheers,
Bob
For noise I can understand the need for weighting but not for distortion.
🙂😎
-RNM
Sorry for the stupid question ... the shipping to Europe is ok or is better to wait May or June ? Thanks ! ;-)
QA401 unboxing and initial quick start tests, part 1
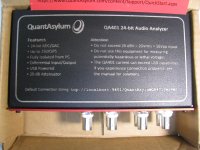
I had decided against getting a QA401 due to concerns about the power supply. After exchanging some email with QA support though last week I decided to go ahead and get one, so here is a QA 401 unboxing! 🙂
I'm running through the set of "quick start" tests posted on their website here:
QA401 Quick Start
For the measurements I'm using the latest V1.46 software, dated 4/18/2016, from their website here:
File Downloads
QA claims their later design work eliminated any significant advantage of +/-15Vdc power rails over the +/-6.5, or whatever they are using, past the comments in their earlier initial blog post about some performance being left on the table at the lower voltage rails. They also say that the source of what appears to be a small amount of DC-DC converter noise some folks have seen is most likely a bad/worn USB cable and not the converter. QA says they have seen the effect themselves.
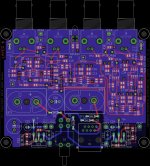
I've just sent the Akerberg-Mossberg fully differential notch filter board below off to fabrication. I'm curious to see how well it works with the QA401 given that the QA401 is fully differential.
Photos (clicking in the lower left corner of the photo will zoom the size up):
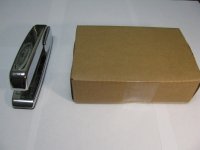
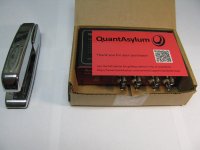
* The first 5 are the unboxing. The stapler is there for a size comparison.
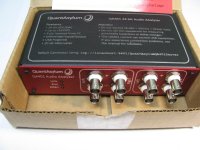
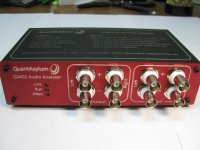
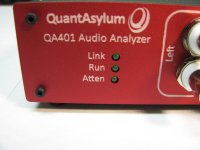
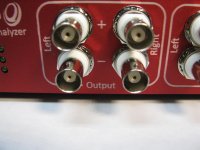
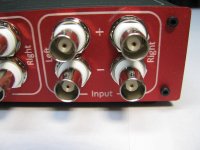
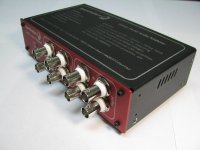
* The next 4 are close-ups of the front panel.
I had decided against getting a QA401 due to concerns about the power supply. After exchanging some email with QA support though last week I decided to go ahead and get one, so here is a QA 401 unboxing! 🙂
I'm running through the set of "quick start" tests posted on their website here:
QA401 Quick Start
For the measurements I'm using the latest V1.46 software, dated 4/18/2016, from their website here:
File Downloads
QA claims their later design work eliminated any significant advantage of +/-15Vdc power rails over the +/-6.5, or whatever they are using, past the comments in their earlier initial blog post about some performance being left on the table at the lower voltage rails. They also say that the source of what appears to be a small amount of DC-DC converter noise some folks have seen is most likely a bad/worn USB cable and not the converter. QA says they have seen the effect themselves.
I've just sent the Akerberg-Mossberg fully differential notch filter board below off to fabrication. I'm curious to see how well it works with the QA401 given that the QA401 is fully differential.
Photos (clicking in the lower left corner of the photo will zoom the size up):
* The first 5 are the unboxing. The stapler is there for a size comparison.
* The next 4 are close-ups of the front panel.
Attachments
-
 IMG_4125.JPG167.4 KB · Views: 454
 -
 IMG_4126.JPG188.5 KB · Views: 459
 -
 IMG_4128.JPG247.3 KB · Views: 451
 -
 IMG_4129.JPG333.2 KB · Views: 451
 -
 IMG_4131.JPG233.6 KB · Views: 160
 -
 IMG_4135.JPG212.4 KB · Views: 160
 -
 IMG_4134.JPG195.7 KB · Views: 139
 -
 IMG_4133.JPG217 KB · Views: 155
 -
 IMG_4132.JPG229.9 KB · Views: 153
 -
 akerberg mossberg notch filter B3-080 case.jpg980 KB · Views: 285
Last edited:
QA401 unboxing and initial quick start tests, part 2
...I ran out of photo slots on the post above, so here is part 2.
Clicking in the lower left corner of the photo will zoom the size up:
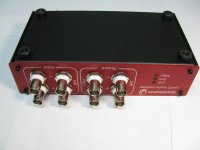
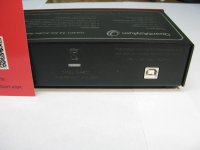
* The next 3 photos show the other sides of the box. The card on the back is covering up the serial number. 🙂
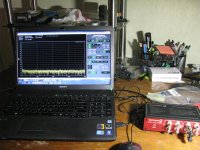
* The next photo shows the test setup. Another reason I went ahead and bought the unit is I realized this particular laptop has one combo eSATA/USB port over on the left side that supplies up to 800mA, enough for the QA401's 600mA maximum draw. Failing that you could try QA's suggestion of a a USB Y cable, or get a USB hub rated at 1A per port if your USB port can't handle 600mA.
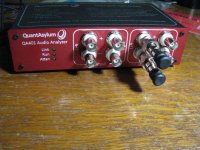
* The next photo and screen grab are the first steps in QA's quick start testing. Their procedure says to short both left inputs and look for -120dBFS power. From the screen grab I am, in fact, getting -120.0dBFS!
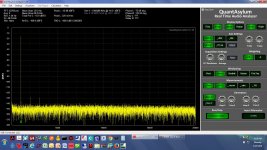
* Next is the final quick start test, a loopback. The left minus input remains shorted while the left + output is connected to the left + input via the BNC cable. The generator is set for -16dBFS and the FFT depth to 32K, as per the procedure. Their procedure says to look for -110dBFS THD. From the screen grab I'm getting -108.6, close enough! They forgot to say hit the "log" button in their procedure, since the plot they show is with the log. I've included both the linear and log plots here. The 2nd and 3rd harmonics from the ADC in unit show up, as other folks have reported. It would be nice if those were less prominent, but at least if I know the magnitude in loopback here I can subtract it out of any measurements.
...I ran out of photo slots on the post above, so here is part 2.
Clicking in the lower left corner of the photo will zoom the size up:
* The next 3 photos show the other sides of the box. The card on the back is covering up the serial number. 🙂
* The next photo shows the test setup. Another reason I went ahead and bought the unit is I realized this particular laptop has one combo eSATA/USB port over on the left side that supplies up to 800mA, enough for the QA401's 600mA maximum draw. Failing that you could try QA's suggestion of a a USB Y cable, or get a USB hub rated at 1A per port if your USB port can't handle 600mA.
* The next photo and screen grab are the first steps in QA's quick start testing. Their procedure says to short both left inputs and look for -120dBFS power. From the screen grab I am, in fact, getting -120.0dBFS!
* Next is the final quick start test, a loopback. The left minus input remains shorted while the left + output is connected to the left + input via the BNC cable. The generator is set for -16dBFS and the FFT depth to 32K, as per the procedure. Their procedure says to look for -110dBFS THD. From the screen grab I'm getting -108.6, close enough! They forgot to say hit the "log" button in their procedure, since the plot they show is with the log. I've included both the linear and log plots here. The 2nd and 3rd harmonics from the ADC in unit show up, as other folks have reported. It would be nice if those were less prominent, but at least if I know the magnitude in loopback here I can subtract it out of any measurements.
Attachments
-
 IMG_4138.JPG167.9 KB · Views: 135
 -
 IMG_4137.JPG159.4 KB · Views: 144
 -
 IMG_4136.JPG183.9 KB · Views: 256
 -
 IMG_4139.JPG305.4 KB · Views: 217
 -
 IMG_4140.JPG335.7 KB · Views: 249
 -
 Left internal generator linear.jpg258.3 KB · Views: 260
 -
 Left internal generator log.jpg250.6 KB · Views: 265
 -
 IMG_4142.JPG314.5 KB · Views: 250
 -
 Left in short -120dB.jpg243.9 KB · Views: 239
Last edited:
adgr
Nice work.
Have you tried THD + N?
I am curious how does the USB-based power affect the Noise floor.
Nice work.
Have you tried THD + N?
I am curious how does the USB-based power affect the Noise floor.
The generator is set for -16dBFS
Do you have ADC measurements at the high input level (i.e. -1-3dBFS)?
Thanks for doing this.
Can we see what a 1kHz fundamental looks like past 20kHz with the QA401 set to 192KSPS?
Can we see what a 1kHz fundamental looks like past 20kHz with the QA401 set to 192KSPS?
Whoops, I see a typo! In "part 2" the measured power level on the screen capture is -119.7dBFS, not -120.0. I was looking at the number under it. Still, close enough!
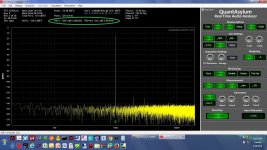
Here is another fun feature of the software. A box can be dragged around any part of the screen and it will do a zoom. Click on the axis button to reset the zoom.
Here is another fun feature of the software. A box can be dragged around any part of the screen and it will do a zoom. Click on the axis button to reset the zoom.
Attachments
Remember that you can click on the lower left corner of any of these to zoom them up...
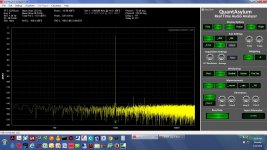
The first screen grab below has the THD+N added.
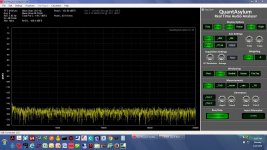
The second screen grab is with the generator set for -3dBFS. The 5th & 7th harmonics pop out at this level.
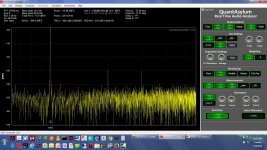
The 3rd screen grab is set to the 192K samples. I've extended the X axis to 80KHz. The max frequency of the THD and THD+N measurements are changed to 80KHz from the default 20KHz.
Have you tried THD + N?
The first screen grab below has the THD+N added.
Do you have ADC measurements at the high input level (i.e. -1-3dBFS)?
The second screen grab is with the generator set for -3dBFS. The 5th & 7th harmonics pop out at this level.
Thanks for doing this.
Can we see what a 1kHz fundamental looks like past 20kHz with the QA401 set to 192KSPS?
The 3rd screen grab is set to the 192K samples. I've extended the X axis to 80KHz. The max frequency of the THD and THD+N measurements are changed to 80KHz from the default 20KHz.
Attachments


Last edited:
I would like to check the 401 for harmonic measurement accuracy below -100dbv against my reference gear. I like the small size and quick and easy use -- and portability --- of the QA400-401 products. I have the 400 but not the 401. Yet.

THx-RNMarsh
THx-RNMarsh
It looks like using a notch filter at the higher input levels is going to be crucial with the QA401.
RNMarsh - nice setup! I think the QA401 would run away and hide... 😀
RNMarsh - nice setup! I think the QA401 would run away and hide... 😀
Last edited:
Looking good agdr.
As you go through your measurements etc some of what I found might help out.
And as you look at things and make some plots....
Might give your Victor's Oscillator a go.
From what I learned from our friend Richeem,
who helped educate me on FFTs:
FFT 32,000+ will begin the yield for frequency accuracy.
Hann window is better for frequency measurements
Flat Top window is better for amplitude measurements
Then you'll find your averages will help settles the plots
down a bit. It's a nice tool to see what's happening.
Enjoy.
Richard,
Welcome back, how's it feel to be home again?
At below -100 dB what have you observed happening
or not happening with the QA400?
How would we identify it? or check it against a good reference?
Thanks,
Sync
Welcome back, how's it feel to be home again?
At below -100 dB what have you observed happening
or not happening with the QA400?
How would we identify it? or check it against a good reference?
Thanks,
Sync
It feels good and tired all during the day and awake through the night.
Things get more accurate below -100 when a notch filter is used. Without it, there are very different levels of harmonics between 400 and these other instruments.... which BTW all use built-in notch filters.
THx-Richard
Things get more accurate below -100 when a notch filter is used. Without it, there are very different levels of harmonics between 400 and these other instruments.... which BTW all use built-in notch filters.
THx-Richard
- Home
- Design & Build
- Equipment & Tools
- QuantAsylum QA400 and QA401