Popilin provide this polit in his post #242. He said in post#245 that it is for "my poor 5R4GY". So it appears he wants us to believe he measured it. In a later post he implied he did it with multimeters.

Popilin's plot is simpy too good, too close in shape to basic theory, to be true.
The 5R4GY is a large directly heated rectifier.
His plot below 60V should approximately match up with the plate charcteristic shown in the RCA datasheet (page 3), but there is no ressemblance whatsoever! The RCA plot shows no evidence of saturation at or below 60V, and a current of ~340 mA. Popilin's plot shows saturation at about 9V and a current at 60V of 13V!
I don't have any 5R4GY. I do have other similar large rectifiers, but they are being carefully kept for when they are needed in equipment.
I do have a large number of 1T4. This is a 1.4 battery RF pentode. By strapping the control grid and screen grid to the anode, it can be considered a directly heated diode, and in many ways a tiny scaled down directly heated rectifier.
The 1T4 is part of the RCA 1T4/1R5/1S5/3V4 etc series. All have a standardised filament rated for 50 mA at 1.4 V and having a maximum anode+screen current rating of 6 mA. The output tubes have two filaments and thus a maximum anode_screen rating of 12 mA.
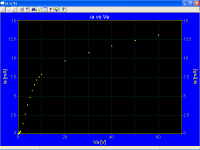
I took 5 NOS tubes from stock and verified that emission was good and there is no evidence of gas. I then measured Ia vs Va, starting each run a 0V and ending at 30V, for each tube. I averaged the data to produce a plot.
Measurment set up: Regulated power supplies were used to supply the heating voltage and the anode voltage. A Fluke 45 was used to set the filament energisation to exactly 1.40V. A second Fluke 45 (dual range - 2 multimeters in one) under computer control monitored the anode voltage and current. Each run was done in steps of 0.5 V, 5 seconds per step, 5 minutes in total. For each step, the computer software commanded another 0.48 V from the anode power supply, measured the anode voltage, computed a correction for a 0.5V step, and commanded the correction. This was done so that power supply DAC error and ammeter resistance in series with the tube were compensated for.
The run time is long enough to allow the filament temperature to stabilise at each point, but not too long as to evapoate too much Ba and ruin the tubes.
Since the filament is rated for 6 mA emission, then because of the Western tube industry standard of engineering cathodes and filaments for emission saturation of 2.5 times the maximum service rating, we may expect saturation at 15 mA.
Here is the plot, with linear axes (if you don't see the plot, click on the attachment tag):-
View attachment 500025
We see that the plot corresponds to the three-halves power rule up to about 10V. From 10V to about 14V, the plot veers to the right of the three-halves line. Can you say why, Popilin? I can, but I bet you cannot. If anyone wants to know, send me a private message. Otherwise, I post the answer here in a few days. It's quite simple.
At about 15V there is an apparent saturation. The plot is almost horizontal between about 20 and 25V. You might think this is a schottky line, but it is way too high, close to 20V. Was RCA that sloppy in their design? I don't think so, and my tubes are late production by non-RCA factories.
The plot curves increasing upward beyond 25V. Thisis due to the emsiion current flowing through the oxide coating, causing I^2.R heating, and in the filament, casing more heating. At 30V, the emission current has increased the current at the filament -ve pin from 50 mA to 62 mA, and reduced it to 38 mA at the +ve pin (approx). So one half of the filament runs cold and the other runs hot. The increase in emission at the hot end is larger than the drop in at the cold end.
For a 5R4GY with DC heating, the corresponding currents would be: static heating current 2.0 A, at saturation, an increase to greater than 2.5 A and drop to 1.5 A.
The region between about 20 and 25V looks like a schottky line but it is a false one. It comes about due to two a main opposing phenomena - schottky effect in the oxide layer, and depletion of surface barium over time (after all the tube is seriously overloaded during this test). The emission current is contributing extra filament heating, jacking the line upward.
If I had done runs returning from 30V back down to zero, the line would be below the upward going line, ie a loop woulkd be formed. This is because the free barium is depleted. I didn't do this because it would partially ruin the tubes.
Fortunately, with the runs I did, running the filaments at 1.8V for 10 to 15 minutes frees up more barium from BaO and restores emission. In use, the distribution of free barium in the oxide layer will further normalise.
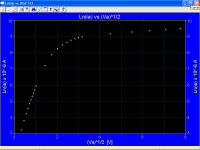
Here, to keep Popilin happy, is a plot with log vs root axes:-
View attachment 500026
Such a plot is just about useless. Even if the near horizontal part was a valid shottky line, it is way too short to apply a straight shottky line to and expect any accuracy, or confirm schottky effect. Schottky effect does of course occur in the oxide coating type tubes, but you can't tell its extent from these plots.
If I had programmed the computer to do the run over a longer time, the plot beyond 20V would slope downwards due to Ba depletion. If I had done it faster, the line slope upwards. If I had done it with short pulse techiques (curve tracer), the sharp increase beyond 25V would not have occurred, and the plot would be at a lower current and look much more like a schottky straight line.
The upshot of all this? Real tubes don't follow basic Schottky theory. I don't think Popilin has done anything better than read a book without acquiring real knowlege of tubes that comes in the lab, and he's basically made things up.
NOTE 1: Depending on manufacturer, 1T4's and the other tubes in the series were made with at least two different filament designs. The RCA design, used by RCA and associated companies (eg Brimar, AWV) used a tungsten-molybdenum alloy wire and their standard fine grain Ba/Sr/Ca carboate mix. The design used by Philips/Mullard used a pure tungsten wire and a diffrent carbonate mix. The filament current cold and hot at 1.4V is very closely the same, but the current drawn at 0.7 V is different.
The five tubes I used all had RCA type filaments. 2 made by Brimar (UK), 2 made by AWV (Australia), and one branded Philips Made in Australia. I have noted serval features that indicate it was actually made by AWV.
I did one run on a genuine Mulard UK tube and it was quite different.
Popilin's plot is simpy too good, too close in shape to basic theory, to be true.
The 5R4GY is a large directly heated rectifier.
His plot below 60V should approximately match up with the plate charcteristic shown in the RCA datasheet (page 3), but there is no ressemblance whatsoever! The RCA plot shows no evidence of saturation at or below 60V, and a current of ~340 mA. Popilin's plot shows saturation at about 9V and a current at 60V of 13V!
I don't have any 5R4GY. I do have other similar large rectifiers, but they are being carefully kept for when they are needed in equipment.
I do have a large number of 1T4. This is a 1.4 battery RF pentode. By strapping the control grid and screen grid to the anode, it can be considered a directly heated diode, and in many ways a tiny scaled down directly heated rectifier.
The 1T4 is part of the RCA 1T4/1R5/1S5/3V4 etc series. All have a standardised filament rated for 50 mA at 1.4 V and having a maximum anode+screen current rating of 6 mA. The output tubes have two filaments and thus a maximum anode_screen rating of 12 mA.
I took 5 NOS tubes from stock and verified that emission was good and there is no evidence of gas. I then measured Ia vs Va, starting each run a 0V and ending at 30V, for each tube. I averaged the data to produce a plot.
Measurment set up: Regulated power supplies were used to supply the heating voltage and the anode voltage. A Fluke 45 was used to set the filament energisation to exactly 1.40V. A second Fluke 45 (dual range - 2 multimeters in one) under computer control monitored the anode voltage and current. Each run was done in steps of 0.5 V, 5 seconds per step, 5 minutes in total. For each step, the computer software commanded another 0.48 V from the anode power supply, measured the anode voltage, computed a correction for a 0.5V step, and commanded the correction. This was done so that power supply DAC error and ammeter resistance in series with the tube were compensated for.
The run time is long enough to allow the filament temperature to stabilise at each point, but not too long as to evapoate too much Ba and ruin the tubes.
Since the filament is rated for 6 mA emission, then because of the Western tube industry standard of engineering cathodes and filaments for emission saturation of 2.5 times the maximum service rating, we may expect saturation at 15 mA.
Here is the plot, with linear axes (if you don't see the plot, click on the attachment tag):-
View attachment 500025
We see that the plot corresponds to the three-halves power rule up to about 10V. From 10V to about 14V, the plot veers to the right of the three-halves line. Can you say why, Popilin? I can, but I bet you cannot. If anyone wants to know, send me a private message. Otherwise, I post the answer here in a few days. It's quite simple.
At about 15V there is an apparent saturation. The plot is almost horizontal between about 20 and 25V. You might think this is a schottky line, but it is way too high, close to 20V. Was RCA that sloppy in their design? I don't think so, and my tubes are late production by non-RCA factories.
The plot curves increasing upward beyond 25V. Thisis due to the emsiion current flowing through the oxide coating, causing I^2.R heating, and in the filament, casing more heating. At 30V, the emission current has increased the current at the filament -ve pin from 50 mA to 62 mA, and reduced it to 38 mA at the +ve pin (approx). So one half of the filament runs cold and the other runs hot. The increase in emission at the hot end is larger than the drop in at the cold end.
For a 5R4GY with DC heating, the corresponding currents would be: static heating current 2.0 A, at saturation, an increase to greater than 2.5 A and drop to 1.5 A.
The region between about 20 and 25V looks like a schottky line but it is a false one. It comes about due to two a main opposing phenomena - schottky effect in the oxide layer, and depletion of surface barium over time (after all the tube is seriously overloaded during this test). The emission current is contributing extra filament heating, jacking the line upward.
If I had done runs returning from 30V back down to zero, the line would be below the upward going line, ie a loop woulkd be formed. This is because the free barium is depleted. I didn't do this because it would partially ruin the tubes.
Fortunately, with the runs I did, running the filaments at 1.8V for 10 to 15 minutes frees up more barium from BaO and restores emission. In use, the distribution of free barium in the oxide layer will further normalise.
Here, to keep Popilin happy, is a plot with log vs root axes:-
View attachment 500026
Such a plot is just about useless. Even if the near horizontal part was a valid shottky line, it is way too short to apply a straight shottky line to and expect any accuracy, or confirm schottky effect. Schottky effect does of course occur in the oxide coating type tubes, but you can't tell its extent from these plots.
If I had programmed the computer to do the run over a longer time, the plot beyond 20V would slope downwards due to Ba depletion. If I had done it faster, the line slope upwards. If I had done it with short pulse techiques (curve tracer), the sharp increase beyond 25V would not have occurred, and the plot would be at a lower current and look much more like a schottky straight line.
The upshot of all this? Real tubes don't follow basic Schottky theory. I don't think Popilin has done anything better than read a book without acquiring real knowlege of tubes that comes in the lab, and he's basically made things up.
NOTE 1: Depending on manufacturer, 1T4's and the other tubes in the series were made with at least two different filament designs. The RCA design, used by RCA and associated companies (eg Brimar, AWV) used a tungsten-molybdenum alloy wire and their standard fine grain Ba/Sr/Ca carboate mix. The design used by Philips/Mullard used a pure tungsten wire and a diffrent carbonate mix. The filament current cold and hot at 1.4V is very closely the same, but the current drawn at 0.7 V is different.
The five tubes I used all had RCA type filaments. 2 made by Brimar (UK), 2 made by AWV (Australia), and one branded Philips Made in Australia. I have noted serval features that indicate it was actually made by AWV.
I did one run on a genuine Mulard UK tube and it was quite different.
Last edited:
At about 15V there is an apparent saturation. The plot is almost horizontal between about 20 and 25V. You might think this is a schottky line, but it is way too high, close to 20V.
I meant to type:-
At about 15V there is an apparent saturation. The plot is almost horizontal between about 20 and 25V. You might think this is a schottky line, but it is way too high, close to 20 mA.
Your planar diode “grows up” with applied anode voltage in order to maintain constant the electric field, and then the constant (is?) current.
That's right. In previous posts you maintained that it is sufficient to just consider the anode voltage. I'm glad you now recognise anode voltage does not drive schottky effect, and you now think it is the electric field strength.
Now, in any operating tube geometry affects the field strength. And the space charge depresses the electric field negatively. Particularly below saturation, the electric field close to the cathode surface is low, lower than would be the case without a space charge. Even at saturation, there is some space charge. If the tube is a triode, normally the grid will be negative, to the electric field close to the cathode is of opposite polarity to the field near the anode. Electrons that penetrate the inverse field and reach the postive field do so because they were emitted with sufficient velocity.
Think about it. You haven't accounted for any of this, which you ought to if you think external fields affect a cathode's emission.
The voltage drop across the oxide layer has significant effects on tube behavior. It adds an effective negative bias to the tube, reducing current, as just about any tube tedtbook states. It sets up schottky effect, increasing emission slightly.So, all that you can measure referred to emission is Va and ia, and you had no reason to annoy through so much post with your nonsense about it.
In the 1T4 plots, I included a three-halves power line. I had to offset it 1.7 V to the right to get it to line up with the anode current line. The filament energisation (1.4 V end-to-end) is an effective bias of 0.7 V. The rest is due to oxide layer voltage drop and interface layer (if any)voltage drop.
Why do you persist with this sort of garbage? You can't measure the vacuum pressure in a production tube, but we all know it's there.
So, explain where and why I'm wrong, then. So far, you've ignored my explanations of why you are wrong - all you do is repeat and give cheek.No contradiction at all, I gave you two alternate explanations for Schottky effect in conductors; you did not understand any of them, regardless my Tarzan-English.
You are absolutely wrong, and this is the proof that you do not understand Schottky effect.
Giving you the benefit of the doubt and making allowances for presumably poor english, that (local positively charged nuclei that have lost an electron) may be the case for insulators and oxide coatings, but it cannot apply to pure metal cathodes. The charge will be virtually immediately replaced from the electron gas that makes metals conductors.As I said before, in metals (conductors) according with the free electron model, the work function barrier is produced by an excess of electrons spilling out from inside the cathode to a distance of the order of interatomic distance, and these electrons cannot escape easily due to the force exerted by nuclei
If you were correct, one would expect metals that are the best conductors (eg Cu, Ag) to have the lowest work function. If fact Cu's work function is ~4.9 eV, Ag's is ~4.5 eV, and the lowest work function is offered by Rb at 2.1 eV. Cu conducts better than Ag. Rb's conductivity is nearly 8 times worse than Cu.
Who says that thermionically emitted electrons come from stripping nuclei? I've never seen that in a textbook on emission. In insulators that must be so, and in pseudo-semiconductors like oxide cathodes it is presumably so. But in metals the emitted electrons can come from the electron gas.
That makes no sense at all. If they have joined the space charge, they have escaped. The horse has bolted. Whether the barrier is raised or lowered no longer matters.Electrons of the metal (conductor) can escape surpassing the barrier, then and only then, they can be considered part of the electron cloud (space charge); and no, Schottky effect it is not too late for them, because the barrier was already lowered by the external electric field before they were emitted, which is the essence of Schottky effect, which obviously you cannot understand.
This is not to be confused with the fact that compared to the space charge (negative) the cathode in general is more positive (distributed charge) and many if not most space charge electrons will return to the cathode from whence they came.
I don't think you have any idea of how it works, Popilin. You just repeat bits out of books without putting it all together in your own mind.
Even historically, in 1914 Walter Schottky discovered an irregularity in thermionic emission in a valve, now known as the Schottky effect.
No oxide cathodes at that time AFAIK.
Well, Schottky is said to have first reported what is now known as schottky effect in his 1914 paper right enough. I can't read German fluently (esp pre-war German), and Schottky had a reputation of writing things that hardly anyone in the field could understand. When he worked for Seimens & Halske, they provided him with a few bright young Ph.D's to "translate" his works into something regular boffins could understand.
The merit of oxide cathodes was discovered and reported by Wehnelt in 1903. Much research was triggered off. Commercial exploitation had to wait until sufficiently good vacuum pumping techniques were developed, as oxide cathodes are ruined by oxygen and trace amounts of water vapour. Westen Electric were making oxide cathode types in quantity in time for WW1 and for the early carrier telephone systems of Bell. Comsumer exploitation was delayed by the higher cost. The bright emitter tungsten cathodes used in radio sets up to the 1920's were soft (ie they were intentionally gassy). Ionisation of the gas and transformer coupling increased the stage gain, allowing small filaments and offsetting the lack of emission efficiency of oxide cathodes.
It is inconceivable that Schottky, paid by Seimens to be ahead of the pack, was not aware of oxide cathodes and had not done lab work with them.
Last edited:
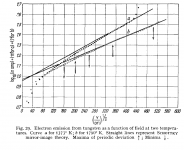
I digitised the anode current (Ia) vs anode voltage (Va) plot from the datasheet and used a curve follower macro in CAD software to produce a list of plot points, at each 0.5V Va increment. I then imported the list into MS-Excel so I could re-plot with both linear and log(Ia)-vs-root(Va) scales. I applied a sliding 5v-wide Hamming window to smooth out digitisation errors.
Here is the log(Ia) vs root(Va) plot:-
Besides this is the wrong plot with the wrong logarithmic function, datasheets are useless in order to search Schottky effect because cathode temperature is too high.
If you want to plot Ln(Ia) vs √Va, you must take your valve and measure with lower filament voltages (lower temperatures) in order to obtain currents in the order of nanoamps for pure tungsten cathodes and microamps for oxide cathodes or little noise diodes as your mentioned A2087.
As you do not know how to make a lab measurement, I guess that I ask too much.
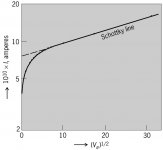
Here is a plot included by Popilin in several of his posts. He claimed it represents a pure tungsten vacuum tube.
As you are not able to understand even a plot, I will post it again, with the proper title; maybe you will realize that it is not my plot, but W. B. Nottingham's plot, from his paper
Phys. Rev. 58, 927 (1940) - Remarks on the Temperature Dependence of the Work Function of Tungsten
Logarithm of thermionic emission current I of tungsten as function of square root of anode voltage Va. (W. B. Nottingham, Phys. Rev., 58:927–928, 1940)
We see that Popilin's plot in no way resembles any real pure tungsten tube, and I'm not talking about it apparently taking 2,000,000 mega-amps at 1 kV - presumably a typo.
Not a typo, Physical Review does not ignore such things, and again, you are not able to understand a plot, as it says “10¹⁰ x I, amperes” it results more than evident that is
Ln(Ia) x 10⁻¹⁰ A vs √Va [Volts]
The first thing we notice is that Popilin's plot has the "schottky line" way way too steep - unbelievably steep. All the pure tungsten types (noise diodes, regulators) I've seen data for have it just about horizontal. For a doubling of voltage, Popilin's schottky line inceases 24% whereas the AV44 line increases only 4%.
As I said before
Js = Jo exp [(α √ Va ) / (k T)]
Then
Ln(Js) = Ln(ia/S) = Ln(ia) - Ln(S) = [α / (k T)] √ Va + Ln(Jo) =
= [α / (k T)] √ Va + Ln(io/S) = [α / (k T)] √ Va + Ln(io) - Ln(S)
It follows that
Ln(ia) = [α / (k T)] √ Va + Ln(io)
For Va high enough, this is a straight line, for a horizontal line it needs T → ∞
Same analysis applies to your nonsense about a horizontal line on ia vs Va.
The slope of “Schottky line” is higher because the temperature is lower, at this point seems to me that you do not understand mathematics.
The second thing we notice is that Popilin's plot to the left of the transition away from the "schottky line" (ie below about root 36 volts, "6" on the scle provided) is completely wrong and impossible. There ought to be a definite slope starting from the origin, following the V^3/2 Langmuir law out from the origin.
Again you confuse the plots, Ia vs Va with Ln(Ia) vs √Va; even worse, in an Ia vs Va plot, you confuse Child-Langmuir law
J = (1 / 9 π) √ (2e / m) (1 / d²) V^(3/2)
With Richardson-Dushman equation at saturation
Js = Jo exp [(α √ Va ) / (k T)]
Let me remind you that near saturation, Child-Langmuir law it is not valid!

At this point, your non understanding of physics makes me remind you that at low enough temperature, you can reach saturation at lower applied voltages.
We can conclude that Popilin's plot was drawn up not from measuring a real tube…
I must repeat that it is not my plot, but W. B. Nottingham's plot, even more; the paper was passed the peer review, so we must conclude that you are not able to understand a simple plot.
Attachments
Last edited:
Popilin's plot is simpy too good, too close in shape to basic theory, to be true.
Thanks! Good job, right? 😎
The 5R4GY is a large directly heated rectifier.
His plot below 60V should approximately match up with the plate charcteristic shown in the RCA datasheet (page 3), but there is no ressemblance whatsoever! The RCA plot shows no evidence of saturation at or below 60V, and a current of ~340 mA. Popilin's plot shows saturation at about 9V and a current at 60V of 13V!
As I said before, on post#138, heater voltages was
With the 5R4GY I used: 1 V, 1.25 V, 1.5 V, 1.75 V, and 2 V
Needless to say that at that heater voltages cathode temperature is low enough to reach saturation at low anode voltages.
BTW, the plot shown corresponds to a heater voltage of 2 V.
I do have a large number of 1T4. This is a 1.4 battery RF pentode. By strapping the control grid and screen grid to the anode, it can be considered a directly heated diode, and in many ways a tiny scaled down directly heated rectifier.
I am glad that you made an experiment, however I cannot see the attachments…please fix it.
A Fluke 45 was used to set the filament energisation to exactly 1.40V.
So, a 1.4 V heater valve was powered with exactly 1.4 V in a thermionic emission experiment???

No words.
Last edited:
No.{Too good to be true}Thanks! Good job, right? 😎
Are you trying to be a smart-***?As I said before, on post#138, heater voltages was { V, 1.25 V, 1.5 V, 1.75 V, and 2 V}
You did not post any graph until post #242 without mentioning the heater voltage or post #138. How is any reasonable person supposed to link the two together? There is no probability that any normal person would. Especially as #138 was is response to a different sub-thread and a post by someone else.
You've lost the plot anyway. It ws my point that schottky effect, while noticeable, did not significantly affect the operation of oxide cathode tubes. Nobody with any sense operates tubes at 40% of the heater voltage rating.
Totally non-relavent to real life operation then.Needless to say that at that heater voltages cathode temperature is low enough to reach saturation at low anode voltages.
BTW, the plot shown corresponds to a heater voltage of 2 V.
I just checked again.{
I am glad that you made an experiment, however I cannot see the attachments…please fix it.
You have to click on the links. Works for me.
So, a 1.4 V heater valve was powered with exactly 1.4 V in a thermionic emission experiment???
So, if you were a doctor, and a patient came in complaining of hot flushes, you would cool them down to -100 C and announce "no you don't"?
Why test at 40% heating voltage (0.56 V)? No only is that pointless, it's not good for the tube.
You have confirmed that, contary to your earlier posts, that schottky effect is too small to matter much in normal tube operation.Besides this is the wrong plot with the wrong logarithmic function, datasheets are useless in order to search Schottky effect because cathode temperature is too high.
Why do you keep posting the same darn graph over and over without change? We've seen it. We don't need it again.As you are not able to understand even a plot, I will post it again, with the proper title
Maybe.maybe you will realize that it is not my plot, but W. B. Nottingham's plot, from his paper
As I said the first time you cited it, I cannot access this. Kindly post the relavent portions of the paper.
Your graph looks way too neat & clean to have been scanned form a 1940 paper - scanned by the on-line publisher or scanned by you. Looks like you did it yourself in MS-Paint or something.
Post a genuine scan of the original page.
In any case, the plot you posted, whatever its origin, is not in the least realistic. It ought to show compliance with the Langmuir V^3/2 law near the origin and it doesn't. That's the sort of error that no person who really knows tubes would ever make.
Actually, the slope should be much the same. The same icrement in anode volatge has the same effect on the apparent work function regardless of temperature.The slope of “Schottky line” is higher because the temperature is lower, at this point seems to me that you do not understand mathematics.
No I didn't.Again you confuse the plots, Ia vs Va with Ln(Ia) vs √Va; even worse, in an Ia vs Va plot, you confuse Child-Langmuir law
J = (1 / 9 π) √ (2e / m) (1 / d²) V^(3/2)
With Richardson-Dushman equation at saturation
Js = Jo exp [(α √ Va ) / (k T)]
I said Langmuir law, and I meant Langmuir law. Go back and read my post properly.
I never said it was. Go back and look - I said it applied near the origin.Let me remind you that near saturation, Child-Langmuir law it is not valid!
I must repeat that it is not my plot, but W. B. Nottingham's plot.....
.
Yeah - you like repetition don't you? Does it help you convince yourself?
Last edited:
1T4 plots reposted so poor Popilin doesn't have to do a mouse click on a text link.
My post #321 explains how thse plots were made.


The graph vertical axis is labelled "anode current". It actually includes grid current as well.
Popilin, can you explain why the plot diverges away from the langmuir law between about 10 V and 12 V? I bet you can't - it's quite simple but it requires a real understanding of tubes and their construction.
I can. If anyone wants to know, send me a PM. Otherwise I will post the reason in a few days.
My post #321 explains how thse plots were made.
The graph vertical axis is labelled "anode current". It actually includes grid current as well.
Popilin, can you explain why the plot diverges away from the langmuir law between about 10 V and 12 V? I bet you can't - it's quite simple but it requires a real understanding of tubes and their construction.
I can. If anyone wants to know, send me a PM. Otherwise I will post the reason in a few days.
Last edited:
BTW, the plot shown corresponds to a heater voltage of 2 V.
Ok. Let's see if we have this right.
You said you measured Ia vs Va on a 5R4GY with 2 V (40% of the normal value) across the filament.
On your plot, we can extend the schottky line to Va = 0 V to get the saturation current at 0 V, i.e., the Richardson-Dushman saturation current. On your plot, its about 7.5 mA.
The RCA datasheet does not of course give the saturation current, but from the information that is included, we can infer for tube industry engineering rules of thumb that at Vf = 5 V it is probably no greater than 1.5 A, certainly no greater than 2 A. The 2 A value is 200 mA per watt heater power.
(By comparison, the 1T4 R-D saturation current @ nominal filament voltage is 15 mA, ie 214 mA per watt.)
Using the Richardson-Dushman equation, we can start with the upper estimate of saturation current (2 A) at Vf = 5 V and see what it would be at Vf = 2 V. It turns out to be about 1.3 mA, not 7.5 mA. More likely about 1 mA.
You have some explaining to do, Popilin.
Hey Keit, your nonsense has almost reached its saturation value, give me a breath; I cannot process it with enough speed… 😀
Wrong plot…again!!!
I must repeat over and over that you must plot Ln(Ia) vs √Va, not Ia vs Va
How do you do your calculations, by throwing dice?
Ok. Let's see if we have this right.
You said you measured Ia vs Va on a 5R4GY with 2 V (40% of the normal value) across the filament.
On your plot, we can extend the schottky line to Va = 0 V to get the saturation current at 0 V, i.e., the Richardson-Dushman saturation current. On your plot, its about 7.5 mA.
Wrong plot…again!!!
I must repeat over and over that you must plot Ln(Ia) vs √Va, not Ia vs Va
The RCA datasheet does not of course give the saturation current, but from the information that is included, we can infer for tube industry engineering rules of thumb that at Vf = 5 V it is probably no greater than 1.5 A, certainly no greater than 2 A. The 2 A value is 200 mA per watt heater power.
(By comparison, the 1T4 R-D saturation current @ nominal filament voltage is 15 mA, ie 214 mA per watt.)
Using the Richardson-Dushman equation, we can start with the upper estimate of saturation current (2 A) at Vf = 5 V and see what it would be at Vf = 2 V. It turns out to be about 1.3 mA, not 7.5 mA. More likely about 1 mA.
How do you do your calculations, by throwing dice?
Take a breath then. I'll wait.Hey Keit, your nonsense has almost reached its saturation value, give me a breath; I cannot process it with enough speed… 😀
And as I explained before it doesn't matter much. Straight lines on anWrong plot…again!!!
I must repeat over and over that you must plot Ln(Ia) vs √Va, not Ia vs Va
Ln(Ia) vs √Va plot are close to straight on a linear plot.
You can check this yourself - there is an error in using a linear plot, but it is only a few percent. Not enough to matter.
Instead of just repeating "wrong again", why not post the value of sat current you get?
How do you do your calculations, by throwing dice?
In more detail:-
First, we need to estimate the filament temperature at 2 V. To do that we need :-
a) Worthing's formula to calculate the electrical resistance of the filament metal (J-wire or tungsten) at any temperature, given the resistance at 1050 K - the temperature at 5 V. For a 5R4GY, the hot resistance is 5 V / 2 A = 2.5 ohms.
b) The formula for electrical input power, V^2/R.
c) The formula for grey body radiant heat loss, P = Af.s.Ef.(Tf^4 - Ta^4)
Af = filament area; Tf = filament surface temperture (close to median temperature), Ta = anode temperature.
For your test conditions, you can take Ta as 300 K. The calc is very insensitive to the actual Ta value.
Strictly speaking You need a value for filament thermal emissivity, Ef. 0.45 will be close enough for a 5R4 filament. It does rise somewhat with temperature, but the rise for a 5R4 will be less than for amplifier tubes due to the rough surface. Then you can take Af.s.Ef as a constant calculated from the 5 V conditions.
As the sytem is highly non-linear, its best done iteratively on computer. I set it up in Excel. You need to allow for the conductive heat loss thru the filament leads proportionately greater at the lower temperature. Comductive heat loss in directly heated tubes is typically about 10 to 13%.
I got a temperature of approx 780 K for 2 V energisation.
By measuring the filament current at 40% voltage with 1T4's, I then knew the resistance (21.8 ohm). Applying Worthing's formula, I got from that a median filament temperature of 764 K. So it checks out.
Using the typical values of the R-D Ao value and for the work function (2.403E-19 J) for RCA cathodes, we can use the Richardson Dushman equation for the saturation current at 1050 K and 780 K. Then we can use simply proportionality to scale both values to match the actual 5 V 5R4GY value (2 A upper limit).
Then we have the R-D saturation current at 2 V.
That is the method I used.
The Ao value and work function for a 5R4 will be different to that for a 1T4, as the 1T4 design employed a smooth slip coated cathode, but the 5R4 design would have used a relatively rough spray coated cathode.
The different Ao value does not matter as in the above calc it cancels out. The work function does matter, but the above value is close enough to get the rough answer needed to check that your work is realistic.
Last edited:
As you are not able to understand even a plot, I will post it again, with the proper title; maybe you will realize that it is not my plot, but W. B. Nottingham's plot, from his paper
Phys. Rev. 58, 927 (1940) - Remarks on the Temperature Dependence of the Work Function of Tungsten
Logarithm of thermionic emission current I of tungsten as function of square root of anode voltage Va. (W. B. Nottingham, Phys. Rev., 58:927–928, 1940)
I'm not wanting to get actively involved in this, but I have been following some of the to and fro. Are you sure you have referenced the right paper? I looked at the paper by W.B. Nottingham that you linked to, but it doesn't seem to have any plots at all. It is just a brief comment, running to just a little more than a single Phys. Rev. column, commenting on a previous paper by J.G. Potter, Phys. Rev. 58, 623 (1940) (which also doesn't have any plot in it).
Chris
Are you trying to be a smart-***?
What does smart-*** means?
Nobody with any sense operates tubes at 40% of the heater voltage rating.
Only people who know how to make a proper measurement.
Totally non-relavent to real life operation then.
It is not about normal operation, but a proper lab measurement, which obviously you never did.
I just checked again.
You have to click on the links. Works for me.
It does not work for me, it appears this message
Invalid Attachment specified. If you followed a valid link, please notify the administrator.
Besides this is the wrong plot with the wrong logarithmic function, datasheets are useless in order to search Schottky effect because cathode temperature is too high.
You have confirmed that, contary to your earlier posts, that schottky effect is too small to matter much in normal tube operation.
This must be more tan evident, from
Js = Jo exp{e √[e E / (4 π ε0)] / k T}
Show me please where I did say the otherwise.
As I said the first time you cited it, I cannot access this. Kindly post the relavent portions of the paper.
I have no access to the paper; I just posted the first plot found around there.
I barely can remember where, but maybe here
Full Size Picture Logarithm-of-thermionic-emission-current-I-of-tungsten-as-function.jpg
But this is irrelevant; it is only an example of Schottky effect in metals.
Your graph looks way too neat & clean to have been scanned form a 1940 paper - scanned by the on-line publisher or scanned by you. Looks like you did it yourself in MS-Paint or something.
Maybe the online publisher digitalized the original plot.
No, it does not looks like my own plots because I work with TableCurve 2D.
In any case, the plot you posted, whatever its origin, is not in the least realistic. It ought to show compliance with the Langmuir V^3/2 law near the origin and it doesn't. That's the sort of error that no person who really knows tubes would ever make.
Total and absolutely unbelievable!!!
You still confuse Child-Langmuir law (aka Langmuir law, aka V^3/2 law, aka 3/2 power law) with Richardson-Dushman equation.
As I said before, Child-Langmuir law
J = (1 / 9 π) √ (2e / m) (1 / d²) V^(3/2)
It is for Ia vs Va plots, and beyond a region way below saturation it is not valid!!!
The posted plot is Ln(Ia) vs √Va, and it corresponds to Richardson-Dusman equation in the form
Js = Jo exp [(α √ Va ) / (k T)]
Which in turn gives
Ln(ia) = [α / (k T)] √ Va + Ln (io)
In your own words
That's the sort of error that no person who really knows tubes would ever make.
Actually, the slope should be much the same. The same icrement in anode volatge has the same effect on the apparent work function regardless of temperature.
No, this is nonsense, read the equation; the slope of the straight line is inversely proportional to the temperature…you still do not understand Schottky effect.
I said Langmuir law, and I meant Langmuir law. Go back and read my post properly.
You must realize that Langmuir law, Child-Langmuir law, V^3/2 law and 3/2 power law are the same thing…
I never said it was. Go back and look - I said it applied near the origin.
No, which you said
The second thing we notice is that Popilin's plot to the left of the transition away from the "schottky line" (ie below about root 36 volts, "6" on the scle provided) is completely wrong and impossible. There ought to be a definite slope starting from the origin, following the V^3/2 Langmuir law out from the origin.
As I explained previously, this is pure nonsense.
Last edited:
I'm not wanting to get actively involved in this, but I have been following some of the to and fro. Are you sure you have referenced the right paper? I looked at the paper by W.B. Nottingham that you linked to, but it doesn't seem to have any plots at all. It is just a brief comment, running to just a little more than a single Phys. Rev. column, commenting on a previous paper by J.G. Potter, Phys. Rev. 58, 623 (1940) (which also doesn't have any plot in it).
Chris
A brief comment of two pages?
The plot says
W. B. Nottingham, Phys. Rev., 58:927–928, 1940
And the link only mention page 927- Seems strange because the online publisher of the plot is McGraw-Hill...
Maybe they cited the wrong paper, maybe the correct is
Phys. Rev. 49, 78 (1936) - Thermionic Emission from Tungsten and Thoriated Tungsten Filaments
Note that again it has only one page...strange.
BTW, Mr. Nottingham have a lot of papers and even books...
Last edited:
Take a breath then. I'll wait.
OK, thanks. Tomorrow I will make a trip, so do not miss me… 😛😀
And as I explained before it doesn't matter much. Straight lines on an
Ln(Ia) vs √Va plot are close to straight on a linear plot.
You can check this yourself - there is an error in using a linear plot, but it is only a few percent. Not enough to matter.
No, you are wrong…again.
Plotting Ln(Ia) vs √Va is the way to guarantee a straight line.
Instead of just repeating "wrong again", why not post the value of sat current you get?
For the record, were you who asked for…
5R4GY, heater voltage 2 V
From the last plot
Ln(io) ≈ 8.77 µA
Then
io ≈ 6.44 mA
c) The formula for grey body radiant heat loss, P = Af.s.Ef.(Tf^4 - Ta^4)
Af = filament area; Tf = filament surface temperture (close to median temperature), Ta = anode temperature.
Hey Keit, you are cheating us, Stefan-Boltzmann law, with some makeup; it still needs the cathode area...
Let me guess…your little gopher perhaps? 😀
Attachments
No, you are wrong…again.
Plotting Ln(Ia) vs √Va is the way to guarantee a straight line.
Can't you read graphs?
I asked you to give your estimate of the saturation current. As usual, you haven't.
Ok, I will give it, using your log-vs-root graph. The best fit schottky line passes can be considered as that pasing thru the current at 20 V (root Va = 4.472, Ln(Ia) = 2.251 ) and 60 V (root Va = 7.746, Ln(Ia) = 2.565). Then by simple proportionality, Ia at 0 V is 9.1 mA.
You silly moo, Popilin, by doing it "correctly" as per your posts, you get an answer for saturation current slightly bigger than my estimate of 7.5 mA.
This establishes that your "measured" value is a bit less likely to be reality.
For the record, were you who asked for…
5R4GY, heater voltage 2 V .....
Oh, right, more copies of your graphs. Just what the world needs.
And no, I did not ask for it.
This appears to be your plot for Vf = 1 V.From the last plot
Ln(io) ≈ 8.77 µA
Then
io ≈ 6.44 mA
Reading off your graph in your first post of it, I got ~6 uA too.
Trouble is, if you estimate it from by the method I explained in my post #332, it turns out it should be ~47 nA. You are out by 2 orders of magnitude. So, it appears something went wrong in your measurement.
Hey Keit, you are cheating us, Stefan-Boltzmann law, with some makeup; it still needs the cathode area...
Let me guess…your little gopher perhaps? 😀
Can't you read? Can't you calculate simple proportionality?
As I said before, you don't need to know the cathode area. In the formula P = Af.s.Ef.(Tf^4 - Ta^4) for Vf = 5 V, we know P (its 10 W), we know Tf (its 1050 K, the standard oxide cathode operating temperature), and we know Ta with sufficient accuracy (you can assume 700 K, but due to the ^4 power terms its really doesn't matter much), so we can calculate the constant Af.s.Ef. And that's all we need, to calculate the cathode radiation heat loss at any other temperature.
Use the plots provided again in my post #329 then.It does not work for me, it appears this message
Invalid Attachment specified. If you followed a valid link, please notify the administrator.
I have no access to the paper; I just posted the first plot found around there.
I barely can remember where, but maybe here
Full Size Picture Logarithm-of-thermionic-emission-current-I-of-tungsten-as-function.jpg
Oh, I see now. You did not get the plot from a peer reviewed paper by W.B. Nottingham as you spuriously claimed. You just grabbed some random unjustified picture from the web.
You cited a reference as though you had accessed and read it - and now it is revealed that you have never even seen it.
You did not see that the plot is not valid, and you did not bother to check the cited reference.
Your lack of honesty and complete lack of attention to detail means we can have no faith in anything you say.
Total and absolutely unbelievable!!!
You still confuse Child-Langmuir law (aka Langmuir law, aka V^3/2 law, aka 3/2 power law) with Richardson-Dushman equation.
.....
No, which you said
Originally Posted by Keit:
The second thing we notice is that Popilin's plot to the left of the transition away from the "schottky line" (ie below about root 36 volts, "6" on the scale provided) is completely wrong and impossible. There ought to be a definite slope starting from the ORIGIN, following the V^3/2 Langmuir law out from the ORIGIN.
Thank you for quoting me exactly. It confirms that:-
a) I know exactly what the Child-Langmuir law (aka Langmuir law, aka V^3/2 law, aka 3/2 power law) is;
b) You are off in the land of the fairies, as you cannot recognise a basic error in the plot.
Because, of course, as your plot does not follow 3/2 power law near the origin, it is in consequence still incorrect as the line begins to approach the schottky line - the line is too close to the vertical axis the whole time. Something that is obvious if you compare with other plots of Ia vs Va.
Last edited:
Using the Richardson-Dushman equation, we can start with the upper estimate of saturation current (2 A) at Vf = 5 V and see what it would be at Vf = 2 V. It turns out to be about 1.3 mA, not 7.5 mA. More likely about 1 mA.
You silly moo, Popilin, by doing it "correctly" as per your posts, you get an answer for saturation current slightly bigger than my estimate of 7.5 mA.
This establishes that your "measured" value is a bit less likely to be reality.
As your super duper planar diode can grow up from 5 mm to 20 mm anode-cathode spacing, your estimate for saturation current also can grow up from 1 mA to 7.5 mA.
Now the dice are loaded… 😀
Huh, luck of honesty… 🙄
This appears to be your plot for Vf = 1 V.
Reading off your graph in your first post of it, I got ~6 uA too.
Trouble is, if you estimate it from by the method I explained in my post #332, it turns out it should be ~47 nA. You are out by 2 orders of magnitude. So, it appears something went wrong in your measurement.
You are throwing dice…again.
Putting random numbers do not change anything, your physics is still pathetic.
As I said before, you don't need to know the cathode area. In the formula P = Af.s.Ef.(Tf^4 - Ta^4) for Vf = 5 V, we know P (its 10 W), we know Tf (its 1050 K, the standard oxide cathode operating temperature), and we know Ta with sufficient accuracy (you can assume 700 K, but due to the ^4 power terms its really doesn't matter much), so we can calculate the constant Af.s.Ef. And that's all we need, to calculate the cathode radiation heat loss at any other temperature.
Besides this is not a calculation but a guess, it is wrong.
Cathode temperature, measured with retarding potentials, at 2 V
T = (604 ± 25) ºK
Far away your guessed 780 ºK
Oh, I see now. You did not get the plot from a peer reviewed paper by W.B. Nottingham as you spuriously claimed. You just grabbed some random unjustified picture from the web.
You cited a reference as though you had accessed and read it - and now it is revealed that you have never even seen it.
You did not see that the plot is not valid, and you did not bother to check the cited reference.
Your lack of honesty and complete lack of attention to detail means we can have no faith in anything you say.
I apologize for that, was not my intention.
No lack of honesty, naively I trusted in the publisher, but hey, resulted to be McGraw-Hill.
Because, of course, as your plot does not follow 3/2 power law near the origin, it is in consequence still incorrect as the line begins to approach the schottky line - the line is too close to the vertical axis the whole time. Something that is obvious if you compare with other plots of Ia vs Va.
My Goodness! Again with this nonsense!
Let’s suppose an Ia vs Va plot, way before saturation obviously it must follow the 3/2 power law, i.e.
Ia = Co V^(3/2)
Then
Ln(Ia) = (3/2) Ln(V) + Ln(Co)
It is not a 3/2 power law anymore!!!
Let’s suppose now the real plot
Ln(Ia) = [α / (k T)] √Va + Ln (Io)
For Va, √Va and Ia → 0, Ln(Ia) → - ∞
Now forget the curve, at the 40’s they had not any software to fit the points, so you must only consider the points and they are consistent with they should be, not to mention the scale factor which you do not understand.
Anyway, if you do not like the plot, I have another 😀😀
Thermionic Emission, Wayne B. Nottingham, 1956, page 102.
Attachments
A brief comment of two pages?
The plot says
W. B. Nottingham, Phys. Rev., 58:927–928, 1940
And the link only mention page 927- Seems strange because the online publisher of the plot is McGraw-Hill...
Maybe they cited the wrong paper, maybe the correct is
Phys. Rev. 49, 78 (1936) - Thermionic Emission from Tungsten and Thoriated Tungsten Filaments
Note that again it has only one page...strange.
BTW, Mr. Nottingham have a lot of papers and even books...
OK, Phys. Rev. 49, 78 (1936) seems much more like it. It's actually quite a long paper (pages 78 to 97), and it has 19 plots, with quite a few showing Schottky current against voltage. (Actually, log(current) vs. sqrt(voltage).)
Chris
- Status
- Not open for further replies.
- Home
- Amplifiers
- Tubes / Valves
- Why Gold Grids