Yes, very nice. So excess phase is what can not be explained by time of flight delay and the acoustic roll-offs?
Right, plot the excess phase and change the time of flight to get the excess phase as flat as you can get it. Then the actual phase and the excess phase will be as close as you can get them.So excess phase is what can not be explained by time of flight delay and the acoustic roll-offs?
Very beautifully put together indeed - thanks.
There is a point in quarter wave horn honk that is not - and can not be - discovered by such measurement / analysis arrangement (or at least can not be pinned down precisely enough).
Its caused by the discontinuity in min phase behaviour caused by reflection effects.
Those reflections and re-reflections actually split the min phase behaviour of a horn into two discrete time windows.
The first time window is from zero to when the first reflection arrives at listening position. The second time window is from this delay time until infinity.
IMO within both time windows a horn (or quarter wave speaker) should be perfectly min phase - but certainly not if seen over full time from zero to infinity.
The result is that we actually can't EQ such quarter wave honking horns to sound *right* - they always will exhibit a specific sound pattern.
Michael
Last edited:
Did you not mean the actual phase and the minimum phase will be as close as you can get them?Right, plot the excess phase and change the time of flight to get the excess phase as flat as you can get it. Then the actual phase and the excess phase will be as close as you can get them.
In addition, the re-reflection issue actually tells us that there is no clean "time after" - actually we have to deal with a (fading out) contamination all the way after the first reflection occurring from any horn contour discontinuity.
So strictly speaking we only have the time window from zero to first reflection arrival thats a clean min phase behaviour and then a next time window form this delay time to the double and so on and so forth...
Things easily get more complicated when there is not only *one* reflection along the contour or from the "mouth" contributing.
😀
Such quarter wave reflections have a distinct difference to a reflection from the floor for example - as such ones don't get repeated in a defined time loop.
Michael
Last edited:
Micheal, it sounds like you are channelling Dr. Geddes now. It does make since, but maybe there are other components as well. Here's to hoping.
Dan
Dan
Zilch, I meant the actual phase and the excess phase will be as close to correct (rather than close together) as possible.
Michael, I agree that, in theory, horn honk is not minimum phase. However, with BMS driver and QSC horn, the effect is small enough that it doesn't show in an ARTA phase measurement. I'll take a look at your 'honker' later.
Michael, I agree that, in theory, horn honk is not minimum phase. However, with BMS driver and QSC horn, the effect is small enough that it doesn't show in an ARTA phase measurement. I'll take a look at your 'honker' later.
IMO, it's easy to get confused and misled by all this phase and group delay stuff. One of the things I really like about ARTA is its ability to plot excess phase and excess group delay. Definitions as I use them:
Actual phase: measured phase with the time of flight removed.
Minimum phase: phase calculated from the magnitude response with a Hilbert-Bode transform. This is the phase that an electrical filter with the same magnitude response would have. If the device under test is minimum phase, electrical EQ will fix the phase response when it fixes the magnitude response. Flat magnitude gives flat phase.
<snip>
Excess phase: actual phase minus minimum phase.
Yes a good explanation within the boundaries of the assumptions. Hilbert warned of using his calculations as direct transformation stating clearly these transforms should only be statistically mapped between domains when the minimum phase condition was not assured. There is no direct mapping available except in the case as this gentleman points out with the assumption that the entire system is "minimum phase." Well that would be a sweet as sugar if it were true. In electronic circuits it is pretty easy to assure minimum phase but in transducers that is not so. For most of what is written here one must first assure the system is minimum phase. Then the rest follows quite easily. If the system is not minimum phase or there are regions which are not minimum phase then statistical mapping is the only available solutions with no direct transformations available.
If any particular transducer system is minimum phase it is very easy to send a complex harmonic waveform such as a bandwidth limited (to that of the transducer) triangle wave through such system and the EQ'd result as described above will be a good approximation of that complex waveform. If it is not minimum phase then the resulting output waveform will be not so close.
In the measurement system describe the region around the center of the energy bandwidth is used as the locater to determine all the excess time. From that the phase is then determined by a lot of statistical mapping. This explanation really does not do justice or is particularly clear to the method so...lots of reading and a much better and clearer explanation:
http://www.audiocontrol.com/t37/5650/19940/Acoustic-Analyzers/Acoustic-Analyzer-Iasysreg.html
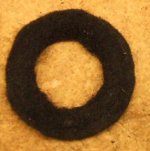
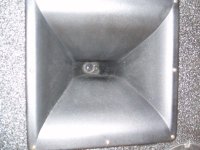
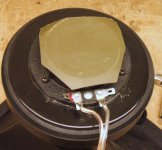
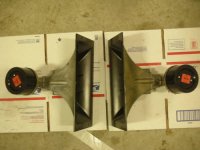
Dayton horn, Eminence driver, & felt ring
Retesting will occur later as soon as we can go back to the big open field when the wind is not blowing 25mph. The original data was not saved.
Here are some pics. Having the felt ring extremely neat is not necessary probably. The back of the diaphragm resonated so a piece of SD .063 from EAR was added and pretty well controlled that.
I believe it was have luck and half educated guess on this.
A little contact adhesive was required to hold the ring to the compression driver.
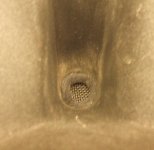
Tested better with screen in place.
Dirt in the horn- wrong!
The ring did change the excess time measurement by a couple of inches closer. One of the problems with all transducers is the apparent source moves closer or further away depending on frequency.
Retesting will occur later as soon as we can go back to the big open field when the wind is not blowing 25mph. The original data was not saved.
Here are some pics. Having the felt ring extremely neat is not necessary probably. The back of the diaphragm resonated so a piece of SD .063 from EAR was added and pretty well controlled that.
I believe it was have luck and half educated guess on this.
A little contact adhesive was required to hold the ring to the compression driver.
Tested better with screen in place.
Dirt in the horn- wrong!
The ring did change the excess time measurement by a couple of inches closer. One of the problems with all transducers is the apparent source moves closer or further away depending on frequency.
Attachments
Last edited:
Here is yet another horn. Does it honk? Funny little Pioneer horn and driver.
Not a real compression driver, I don't think. Very benign impedance curve and flat response. Trade off is lower sensitivity. ~101dB/W
Impulse is attached below in a zip file. You'll see some trouble in the low end, but below where this should be crossed anyway. Response is flat and distortion is low.
Attachments
Hello,
You'll see in attached file a comparison I have done using my Matlab routine (quasiwavelets) between a Le Cléac'h horn (Fc = 320Hz) a JBL waveguide and an OSwaveguide. I modified somewhat my routine in order that the shown graphs are normalized in amplitude.
Elias yet gave some multiresolution wavelets graphs for those horns and waveguides in the message:
http://www.diyaudio.com/forums/multi-way/161627-horn-honk-wanted-33.html
The vertical stripes having an yellow-orange color you can see on the graphs for the JBL and the OS_waveguide appear within the interval of time between 0 and 1ms. This means that there are due to reflexions having a short delay( by that I mean that the correspodning delay is smaller than the delay due to the reflection between mouth and throat.)
IMHO a large part of those short delay reflections are HOMs.
Inversely to the common knowledge waveguide don't have less HOMs than horns. What an OSwaveguide do better than horns is that it uses the HOMs in order to reflect them in various directions in order to obtain a more evenly distributed directivity.
To confirm or not those yellow-orange stripes are du to HOMs we should analyse with the same method the impulse response at different off-axis angles.
Best regards from Paris, France
Jean-Michel Le Cléac'h
Attachments
Last edited:
Hello,
That JBL waveguide was mesured by Earl Geddes. I don't remember if the reference was given... May be someone can give the answer.
Best regards from Paris, France
Jean-Michel Le CLéac'h
That JBL waveguide was mesured by Earl Geddes. I don't remember if the reference was given... May be someone can give the answer.
Best regards from Paris, France
Jean-Michel Le CLéac'h
Hello Jmmic
What JBL waveguide is that??
Rob🙂
Member
Joined 2003
I'd like to see a wavelet or good CSD of the Pioneer horn, but I"m having a devil of a time. Can anyone help? Impulse is attached below.
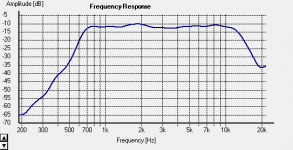
And here is the FR graph. Remarkable for a horn. 2nd harmonic rises sharply below 750Hz (not shown here).
If someone can run a graph on this and tell me what your setting were, that would be great. Thnx
And here is the FR graph. Remarkable for a horn. 2nd harmonic rises sharply below 750Hz (not shown here).
If someone can run a graph on this and tell me what your setting were, that would be great. Thnx
Attachments
Inversely to the common knowledge waveguide don't have less HOMs than horns. What an OSwaveguide do better than horns is that it uses the HOMs in order to reflect them in various directions in order to obtain a more evenly distributed directivity.
Hello Jmmic
That's the way it looks with those measurements but should we be using the above wavelets graphs as comparative examples?? There was a noise issue when Earl made those measurements. That could easily be a reason for all the clutter in the first milisecond. To get this right we really need to get all 3 horns measured under the same conditions using the same driver. Picking up other peoples mearurements and combining them doesn't really help things and adds confusion to the discussion. You don't know the driverS or the conditions the measurements were made under. Are we talking 100mw, 1 watt, 10 watts?? Distance?? Outside with the birds chirping or in my basement with the furnace and refrgerator running??
I am not saying we can't get information from them just that it may not be a fair comparison because of the variables in the measurements.
Rob🙂
Last edited:
Hello Robh,
There is no noise issue there.
Earl send 2 I.R. of his OS waveguide, the first one was noised but the second was not and the the impulse response was validated by Earl after analysis of the waterfal calculated by Jzagaja.
I disagree about the irrelevance of the compared results of the same analysis performed by 2 different persons. The IR given by Earl was chosen by him as representative of what are the mesurements for his waveguide and the measurement of my horn (while rapidly done) is also representative of most measurements done on Le Cléac'h horns IMHO. Nobody will present a measurement that is realized in very bad conditions and not representative of his own design.
You demand for measurements performed in the same conditions seems legitim but is unrealistic IMHO (specially when it comes to Le Cléac'h horns versus OSwaveguides...).
Best regards from Paris, France
Jean-Michel Le Cléac'h
Hello Jmmic
That's the way it looks with those measurements but should we be using the above wavelets graphs as comparative examples?? There was a noise issue when Earl made those measurements. That could easily be a reason for all the clutter in the first milisecond. To get this right we really need to get all 3 horns measured under the same conditions using the same driver. Picking up other peoples mearurements and combining them doesn't really help things and adds confusion to the discussion. You don't know the driverS or the conditions the measurements were made under. Are we talking 100mw, 1 watt, 10 watts?? Distance??
Earl send 2 I.R. of his OS waveguide, the first one was noised but the second was not and the the impulse response was validated by Earl after analysis of the waterfal calculated by Jzagaja
Hello Jmmic
I didn't know there was a second measurement and I stand corrected. Thanks for setting things staright.
same conditions seems legitim but is unrealistic IMHO
Well you are probably right about that. You would need a couple of guys to get them all together to do it as no one seems to have it all on there own.
Rob🙂
- Status
- Not open for further replies.
- Home
- Loudspeakers
- Multi-Way
- Horn Honk $$ WANTED $$