Looks like something wrong in the hardware setup. Usually grounding issue.Michael,
It seems that you haven't gated ghost impulse response. Ghosts could happen with MLS stimuli.
It'll take me some time to crawl up the learning curve, probably; see Chapter 18 of the CLIO 8.5 User Manual for the capabilities:
Download area
Must be fun to work with !
Selection of time frequency trade off is there as well as handy normalization function - but no multi-resolution visualization yet.
Michael
In case you didn't see these in the Le Cleac'h thread here is a photo of Jack and Lukasz' beautiful horns. Too bad international shipping from Poland is so high. $500
Wow, those are incredible looking....Just too expensive to get a hold of though 🙁
Wow, those are incredible looking....Just too expensive to get a hold of though 🙁
True of all the nicer horns out there. It takes some doing to make a nice set of horns! In retrospect, rather than DIYing the OS waveguides I'm working on, I wish I'd just paid the doc to do 'em back when he sold the 15"s.
Poland horn pricing is good
The pricing on the horns from Poland is reasonable but the shipping is high because they are so large. A pair of 12 inch wave guides could be shipped easily but I am not as much interested in those. I can bring 20 of the 350Hz Le Cleac'h horns to the USA for $5000 if I have them leave them uncut with no flanges but I am not going to do that with out first hearing a pair because once you enter this price range, many options open up including the new Mundorf AMT swinging nude and open backed.True of all the nicer horns out there. It takes some doing to make a nice set of horns! In retrospect, rather than DIYing the OS waveguides I'm working on, I wish I'd just paid the doc to do 'em back when he sold the 15"s.
The pricing on the horns from Poland is reasonable but the shipping is high because they are so large. A pair of 12 inch wave guides could be shipped easily but I am not as much interested in those. I can bring 20 of the 350Hz Le Cleac'h horns to the USA for $5000 if I have them leave them uncut with no flanges but I am not going to do that with out first hearing a pair because once you enter this price range, many options open up including the new Mundorf AMT swinging nude and open backed.
Having a tough time finding more info. I might be interested in some WGs.
Contact jzagaja
Contact Jack.
.
http://www.diyaudio.com/forums/members/jzagaja.html
.
Having a tough time finding more info. I might be interested in some WGs.
Contact Jack.
.
http://www.diyaudio.com/forums/members/jzagaja.html
.
Can you get any axis number values to the plots? It would help to interprete.
Sure – no problem ! Color range is 40dB
😉
Jzagaja's measurement of oblate spheroid contour (on axis):

Jzagaja's measurement of LeCleach contour (on axis):

Jzagaja's measurement of Gaussian MinPhase contour (on axis):

🙂
Michael
Last edited:
And finally here are the normalized plots (right side) as well ! Color range still on 40dB
😉
Quasi wavelet analysis of Jzagaja's measurement of oblate spheroid contour (on axis):

Quasi wavelet analysis of Jzagaja's measurement of LeCleach contour (on axis):

Quasi wavelet analysis of Jzagaja's measurement of Gaussian MinPhase contour (on axis):

🙂
Elias, cold you please provide "real" wavelet analysis too - so that we can compare to the "quasi wavelet" analysis above, which I did based on JMLC's code ?
For now I'd say, there are too many reflections all over the place - wherever this comes from - to do any serious comparison between those contours.
But anyway, thanks for providing those measurements, Jzagaja !
Michael
😉
Quasi wavelet analysis of Jzagaja's measurement of oblate spheroid contour (on axis):
Quasi wavelet analysis of Jzagaja's measurement of LeCleach contour (on axis):
Quasi wavelet analysis of Jzagaja's measurement of Gaussian MinPhase contour (on axis):
🙂
Elias, cold you please provide "real" wavelet analysis too - so that we can compare to the "quasi wavelet" analysis above, which I did based on JMLC's code ?
For now I'd say, there are too many reflections all over the place - wherever this comes from - to do any serious comparison between those contours.
But anyway, thanks for providing those measurements, Jzagaja !
Michael
Last edited:
And I hear discussion of interest in "time varying frequency response". But the thing is that when you look at any of these time-frequency transformations and compare the difference of the input and output all you have is the differences, or error, and it is not possible to ascribe what the source/cause of that error is. In the majority of cases if it likely to be some form of stored energy and nothing else. If you want to call the rise in amplitude over time of a resonance to its peak "time dependent frequency response" fine. But it is a manifestation of stored energy.
I don't agree.
To give a picture of the specific sonic pattern occurring from "looped reflections" (quater wave honk that is) I show here measurements that do not need *any* sophisticated processing.
Would not recommend though this to become the standard procedure to detect that sonic pattern of quarter wave horn honk, as its painfully time consuming....
In simplified simulation quarter wave honk due to comb filtering looks like that :
http://www.diyaudio.com/forums/multi-way/161627-horn-honk-wanted-7.html#post2123744

above we see constructive and destructive summation (as parallel of delayed reflections)
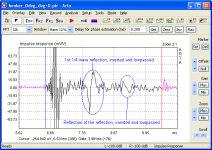
below the illustration of what I've shown in above (extreme) simulation from real measurements on my 0 deg honker:
First the *un-windowed* frequency plot for orientation (indoor / mic at zero distance):

And now in subsequent order all peaks and dips we see in the FR plot above:
My honker simply fed by the frequency of interest and recorded straight away – no signal processing at all !


Well I guess that finally should make 100% clear that above is a sonic pattern that is very specific to recurring reflections and easy to distinguish from "simple" resonance.
There is no doubt that until the first reflection ( < 15ms in this case) we get a frequency response that is completely different from the frequency response later on.
Also there is a sharp discontinuity at exactly the delay time – not at all the same as a resonance that builds up *without* any discontinuity.
In a log scale we possibly would be able to see the re-reflections as well
🙂
Michael
To complete the picture – here is what comes after – the tail *in steps* - what was reflected into the 0 deg horn first arrives after switching off the stimulus delayed :


for the 2500Hz und 2860Hz FR dip and peak frequency respectively
🙂
Michael
for the 2500Hz und 2860Hz FR dip and peak frequency respectively
🙂
Michael
Last edited:
For one meter distance you'll find it here:
http://www.diyaudio.com/forums/multi-way/161627-horn-honk-wanted-8.html#post2126784
For the zero distance measurement above its those ones :
http://www.kinotechnik.edis.at/pages/diyaudio/GD_HighPass/conical/honker_0deg_deg+0_mouth.pir
http://www.kinotechnik.edis.at/pages/diyaudio/GD_HighPass/conical/honker_0deg_deg+0_mouth.wav
Michael
Thanks Michael. The 1m impulse of the 0 degree honker clearly shows the 1/4 wave reflections.

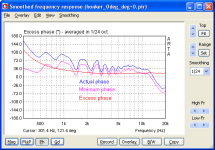
Now taking a look at the phase and my theory that a 'good' horn-driver combo should act like a minimum-phase device with the excess phase being near a flat line and near zero. the 0-degree honker has excess phase even with the time of flight removed.

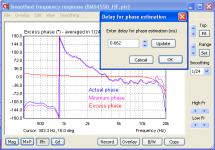
Compare to Doug's BMS4550 + QSC horn. The excess phase above 10K could be due to the BMS breakup but it looks good below there -- flat and near zero. Phase behavior may not be enough to tell the difference between a good horn and a great horn but it may be enough to spot a really bad horn.

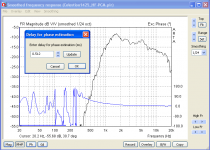
Here's an old pic of Doug's measurement of the Celestion 1425 on the same QSC horn. It looks good up high but starts showing excess phase down low. Ignore everything below 300 Hz due to gating. Doug confirms that, subjectively, it doesn't sound good crossed low.

Now taking a look at the phase and my theory that a 'good' horn-driver combo should act like a minimum-phase device with the excess phase being near a flat line and near zero. the 0-degree honker has excess phase even with the time of flight removed.
Compare to Doug's BMS4550 + QSC horn. The excess phase above 10K could be due to the BMS breakup but it looks good below there -- flat and near zero. Phase behavior may not be enough to tell the difference between a good horn and a great horn but it may be enough to spot a really bad horn.
Here's an old pic of Doug's measurement of the Celestion 1425 on the same QSC horn. It looks good up high but starts showing excess phase down low. Ignore everything below 300 Hz due to gating. Doug confirms that, subjectively, it doesn't sound good crossed low.
Attachments
Last edited:
Hello Catapult,
see my message #370 in date of March 22.
http://www.diyaudio.com/forums/multi-way/161627-horn-honk-wanted-37.html#post2127387
and specially the graph:
http://www.diyaudio.com/forums/atta...269258758-horn-honk-wanted-csd_tube_mige0.gif
Best regards from Paris, France
see my message #370 in date of March 22.
http://www.diyaudio.com/forums/multi-way/161627-horn-honk-wanted-37.html#post2127387
and specially the graph:
http://www.diyaudio.com/forums/atta...269258758-horn-honk-wanted-csd_tube_mige0.gif
Best regards from Paris, France
The 1m impulse of the 0 degree honker clearly shows the 1/4 wave reflections.
My felt arrived (100% wool).
I cut a hole the size of a dime, placed it between the horn and the CD.
Here are some test measurements with my Celestion 1745/QSC 152i waveguide.
Here is the FR plot.
Red is no felt, blue is felt.
CSD needs to be re-run.
I cut a hole the size of a dime, placed it between the horn and the CD.
Here are some test measurements with my Celestion 1745/QSC 152i waveguide.
Here is the FR plot.
An externally hosted image should be here but it was not working when we last tested it.
Red is no felt, blue is felt.
CSD needs to be re-run.
Last edited:
Member
Joined 2003
Different CSD scales?
I didnt think so, I did the measurement one after the other with ARTA and I didnt change anything.
Im trying to see what is different, the changes are very surprising.
Having a tough time finding more info. I might be interested in some WGs.
Group order? Im interested and Im sure I can get others from AVS Forum. If not I will buy extras then sell them later. Someone always wants one after their is some success.
Member
Joined 2003
- Status
- Not open for further replies.
- Home
- Loudspeakers
- Multi-Way
- Horn Honk $$ WANTED $$