BR vs. CB: Harmonic distortion
These measurements done by me have also been posted in a german forum in 2014:
aktives-hoeren.de • Thema anzeigen - Subwoofer - sensorgeregelt/geschlossen vs. Bassreflex
The setting:
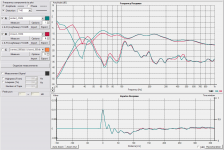
The same driver has been mounted in a BR enclosure and in the same enclosure but with port sealed, which then makes up the CB variant. Base level in sound pressure of 0 dB has been defined at 100% THD of the closed box variant at 30Hz.
Figure 1: THD from 2nd to 10th harmonic and noise at level -6dB: BR(green) vs. CB(red)
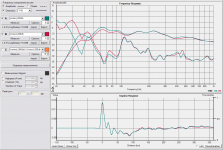
Figure 2: THD from 2nd to 10th harmonic and noise at level -3dB: BR(green) vs. CB(red)
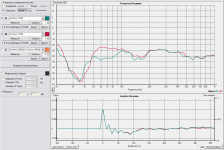
Figure 3: THD from 2nd to 10th harmonic and noise at level -0dB: BR(green) vs. CB(red)
The (absolute) level of the harmonic distortion is about 12 to 14 db lower in the BR variant in a wide range around 35 Hz. When accounting for the relative increase in sound pressure with the BR System at LF, the relative decrease in THD is even higher ...
At large excursions there will also be an effect on FM distortion (Doppler distortion) too, which tends to be audible with music programme, if excursion is high and the driver is operated e.g. up to the midrange in a 2-way System.
These measurements done by me have also been posted in a german forum in 2014:
aktives-hoeren.de • Thema anzeigen - Subwoofer - sensorgeregelt/geschlossen vs. Bassreflex
The setting:
The same driver has been mounted in a BR enclosure and in the same enclosure but with port sealed, which then makes up the CB variant. Base level in sound pressure of 0 dB has been defined at 100% THD of the closed box variant at 30Hz.
Figure 1: THD from 2nd to 10th harmonic and noise at level -6dB: BR(green) vs. CB(red)
Figure 2: THD from 2nd to 10th harmonic and noise at level -3dB: BR(green) vs. CB(red)
Figure 3: THD from 2nd to 10th harmonic and noise at level -0dB: BR(green) vs. CB(red)
The (absolute) level of the harmonic distortion is about 12 to 14 db lower in the BR variant in a wide range around 35 Hz. When accounting for the relative increase in sound pressure with the BR System at LF, the relative decrease in THD is even higher ...
At large excursions there will also be an effect on FM distortion (Doppler distortion) too, which tends to be audible with music programme, if excursion is high and the driver is operated e.g. up to the midrange in a 2-way System.
Attachments

Last edited:
...
Base level in sound pressure of 0 dB has been defined at 100% THD of the closed box variant at 30Hz.
...
Correction (time for editing has elapsed):
0 dB input voltage in the captions of the measurements has been chosen at 100% THD of the CB variant at 35Hz.
The voltage was then lowered by 3 db steps for the subsequent measurements.
I know all this but its not relevant to the question, which was propose a test signal / strategy for fidelity.
Btw, biggest offender in ported systems is port noise and few system really can cope with a sine at port resonance at high level, so the excursion reduction buys you nothing when chuffing dominates.
And yes, sine bass at high levels is normal music signal these days.
Again Klaus,
i am sorry to present plain data saying otherwise:
(Figure 1 below)
Even when extracting "noise only" the BR variant (red) produces less noise in the low to mid bass range (here: 30 to 100Hz) than the CB variant (green).
This comparison has been made at the -3db setting described above:
When furthermore accounting for the fact, that the output of the BR variant is about 5dB higher than the CB around 35Hz, while we compare "absolute" noise levels in this diagram here, than the BR clearly outperforms the CB even in S/N ratio from lower to mid bass frequencies.
And btw:
The port area used here is just "fairly dimensioned" having about 15% of the cone area. There has not even been extensive rounding of the edges of the port or further aerodynamical optimization.
In dimensioning and designing ports even better, there is also a further decrease in noise and and harmonic distortion, which makes the difference to CB even more obvious.
The examples you might rely on - which you unfortunately don't report to detail or even prove here by measurement - may (very likely due to my experience) arise from very poorly dimensioned designs.
But those, as i stated earlier, should not be (mis-) used to make comparisons due to any technology.
Attachments
Last edited:
I know all this but its not relevant to the question, which was propose a test signal / strategy for fidelity.
Btw, biggest offender in ported systems is port noise and few system really can cope with a sine at port resonance at high level, so the excursion reduction buys you nothing when chuffing dominates.
And yes, sine bass at high levels is normal music signal these days.
The examples you might rely on - which you unfortunately don't report to detail or even prove here by measurement - may (very likely due to my experience) arise from very poorly dimensioned designs.
...
Poor desings (within any type of enclosure or loudspeaker) nevertheless may be "commercially available", which is no contradiction at all to "poor design" in electroacustics, as one should know.
But when talking about "technologies" and specific pros and cons, it does not make sense to use poor designs in any comparison made.
I am primarily interested in technologies and their (possible) characteristics rather than "the market", because i am simply not restricted to "customary" (or even "low quality" ?) products in my own development and/or manufacturing.
Last edited:
I know all this but its not relevant to the question, ...
And yes, sine bass at high levels is normal music signal these days.
Klaus,
my measurements presented above are based on a swept sine.
What seems obvious to me instead - and that is a thing you could know - is that your statements concerning noise and distortion in BR vs. CB are based on poorly designed and/or poorly dimensioned BR Systems.
About 2 1/2 years have passed since my presentation of data here:
http://www.aktives-hoeren.de/viewtopic.php?f=16&t=3011&start=30#p91091
And still - although that data is already known even to you - you argue using anecdotes without presenting any meaningful data, that could support what you might call a "point of view" (in terms of technology and associated characteristics not just in being "customary" products found somewhere on some market) ...
Last edited:
When considering BR enclosures and designing the ports for high output while producing low distortion and noise, this is a recommendable paper from 2002:
Maximizing Performance from Loudspeaker Ports
Alex Salvatti and Doug Button, JBL Professional
Allan Devantier, Infinity systems Northridge, California
AES E-Library Maximizing Performance from Loudspeaker Ports
http://jahonen.kapsi.fi/Audio/Papers/AES_PortPaper.pdf
Maximizing Performance from Loudspeaker Ports
Alex Salvatti and Doug Button, JBL Professional
Allan Devantier, Infinity systems Northridge, California
AES E-Library Maximizing Performance from Loudspeaker Ports
http://jahonen.kapsi.fi/Audio/Papers/AES_PortPaper.pdf
Last edited:
...
Even when extracting "noise only" the BR variant (red) produces less noise in the low to mid bass range (here: 30 to 100Hz) than the CB variant (green).
...
Edit:
Of course you see in the noise comparison diagram, that the BR variant ("vented") is the green curve and CB ("closed") is red one.
Last edited:
Guess what! The Nelson Pass crowd has an interesting motional feedback amp design. Curiously, it brings to mind 1957 when positive current feedback was all the rage.*
http://www.diyaudio.com/forums/pass-labs/288077-positive-current-feedback-simple-zen-amp-1.html
Ben
*OK, not everybody can remember 1957 too clearly but it was a big year for me
Ben
http://www.diyaudio.com/forums/pass-labs/288077-positive-current-feedback-simple-zen-amp-1.html
Ben
*OK, not everybody can remember 1957 too clearly but it was a big year for me
Ben
Thanks for posting the link.Would the Holland & Newell Modulation Transfer Function ( MTF) have any added value to the current discussion between Ben+Calvon vs Bolster+Earl?
See here http://eprints.hud.ac.uk/3584/1/IOA_Proceedings_Vol27-8_RS21-2005.pdf
The MTF approach may be advantageous as a real-world measurement technique. The special signal and special analysis gear result in a mysterious number, not otherwise meaningful as a physical parameter.
But you can use the mysterious number to compare Condition A with Condition B and that shows how relatively well the sound system is delivering the signal to the mic under the two conditions and how to nudge it better.
Also, I find sui generic scales producing mystery numbers to be far less meaningful than numbers that are intuitively meaningful and/or relate to things you can see and touch, like a picture of an impulse or a group delay time*.
Ben
*in REW, the impulse and group delay outputs are calculated figures based on the FR and phase measurements... rather than "photos" of the mic pick-up. If so and if you take the REW outputs at face value, once again we have those who trust to a kind of static-truth T/S model versus the empiricists. Is that correct?
This certainly seems to be the path many have found to lead to high quality LF reproduction.…For my part I´ve given up most of my activities around MFB and rather invest in better low-THD (though often costier) drivers in CBs and simple equing.
The change in T/S parameters(in particular suspension compliance, BL product, and inductance) that occur at different points during a single in-out-in cycle of the woofer cone produces nonlinear distortion. A shift in the time averaged value of the suspension compliance or BL product over the cycle, if large enough, can indeed modify the frequency response, or in other words produce a change in the linear distortion that is tied to the impulse response and group delay. Generally with modern woofers, as long as you are operating within the Xmax range you don’t see significant shift in linear distortion. If interested, here is a link to Klippel paper and ARTA application note on estimating the Xmax range based on distortion threshold.… In other words, now you make them part of nonlinear distortion as well... ;-)
http://www.pearl-hifi.com/06_Lit_Ar...2_Assessment_of_VC_Peak_Displacement_XMax.pdf
http://www.artalabs.hr/AppNotes/AP7-EstimationOfLineardisplacement-IEC62458-EngRev01.pdf
You bring up a good point though, and reminded me of an additional trending test that would identify this behavior…a useful test to add to bentoronto’s list. Basically, measure the frequency response for a range of input voltages increasing in 3dB steps. Then adjust each curve down by the increased input level. Ideally, all curves would lie on top of each other within the woofer’s working range. If you notice at higher input voltages the response peaking up above the flatter response of the lower power levels, this could indicate a significant shift in the average T/S parameters. The other possibility is that the voice coil resistance has increased significantly from VC heating which increases Qes. When designing subwoofers where significant VC heating will take place, it may be best to equalize the response after VC has been heated and resistance increased to a nominal “working” level.
Your footnote seems to be a mish-mash of several different issues.…*in REW, the impulse and group delay outputs are calculated figures based on the FR and phase measurements... rather than "photos" of the mic pick-up. If so and if you take the REW outputs at face value, once again we have those who trust to a kind of static-truth T/S model versus the empiricists. Is that correct?
I tried to address them in 2 lumps.
Issue 1: Relationship between FR & phase, impulse and group delay (and measurement techniques)
There is a direct mathematical relationship between all these parameters. Most measurement software available today uses methods other than the classic “tick, tick, tick” of impulses for improved signal to noise ratio. However, if you are so inclined, Praxis still offers the ability to use direct impulse measurement. After selecting the time window of interest, Fourier analysis can be performed to determine the FR,phase,group delay. I can remember back in the early 90s waiting to measure until late at night on a week day to get best LF SN measurements… averaging 100 or more impulses without getting passing auto or aircraft noise contamination was a tough proposition. In a quiet environment the classic impulse technique gives the same results for all parameters as the modern techniques, but it takes a lot longer and careful planning to get that result.
Issue 2: Validity of models based on T/S parameters and if those parameters are static enough to be trusted.
In my experience, with modern woofers used within their usefully linear Xmax range (ie THD < 10%), the average values of the T/S parameters do not vary enough to invalidate the model and can be trusted. The test I suggested above in post#691 would be a good way of determining the "static" range. In other words, trust by verify. 😉
The one possible exception is VC resistance. When woofers are driven hard enough/long enough the VC resistance will increase by a significant amount and Qes will increase. In this case, the model is still valid, but the Qes parameter cannot be considered as “static”. This is a very common problem in the car audio/subwoofer arena, much less so for home audio.
Let me see, is there a "but..." missing?Your footnote seems to be a mish-mash of several different issues.
I tried to address them in 2 lumps.
Issue 1: Relationship between FR & phase, impulse and group delay (and measurement techniques)
There is a direct mathematical relationship between all these parameters
Does that pure math relationship hold up in its theoretical beauty only when the bits and pieces are behaving well?
I gather from what you say (or rather, from what you don't deny) that the impulse and group delay pictures in REW aren't "photos" of what the REW mic picks up but rather constructions from FR and phase?
So to the degree that Rice-Kellogg drivers are showing adult behaviour and to the extent that the at-rest T/S parameter are stable when the cone gets moving, we can trust the pictures. Or maybe not.
Can anybody post: a picture from a scope of how a mic sees a BR box handling an impulse as well as how REW thinks it should look (as well as what the drive signal to the amp looks like, as good lab technique).
Thanks for suggesting the technique "Ideally, all curves would lie on top of each other". I've been eyeballing just such curves for past few days, comparing inputs to mic results as well as the the signal emanating from an old MF amp* that was lying around. Alas, there were phases shifting, hard for me to get curves superimposed directly on top of one another well enough to eyeball the deviations.
B.
*of course, the drive signal coming out of an MF amp is itself distorted since its purpose is to de-distort what the speaker is distorting; a lot cleaner than eyeballing mic traces
Last edited:
The mathematical relationship holds up under all circumstances.Let me see, is there a "but..." missing? Does that pure math relationship hold up in its theoretical beauty only when the bits and pieces are behaving well?
No caveats, no buts…no coconuts.
I’m not sure what you mean by pictures vs. photos. REW plots the data captured by the mic or voltage probe. There is a direct mathematical relationship between the different plots REW shows of this captured data. REW uses the Farina swept sin measurement method. (AES E-Library Simultaneous Measurement of Impulse Response and Distortion with a Swept-Sine Technique) If you want to see the signal data captured by REW during the frequency sweep, just click on the oscilloscope graph option. You will see a plot of the signal sent from REW to your amplifier superimposed with the signal captured by your mic or voltage probe. Again, all plots shown by REW are mathematically tied to this signal capture.I gather from what you say (or rather, from what you don't deny) that the impulse and group delay pictures in REW aren't "photos" of what the REW mic picks up but rather constructions from FR and phase?
The plots of captured data from REW can always be trusted, no matter how ill-behaved or overdriven your woofer is.So to the degree that Rice-Kellogg drivers are showing adult behaviour and to the extent that the at-rest T/S parameter are stable when the cone gets moving, we can trust the pictures. Or maybe not.
You still seem to be mixing up modeling and measurement issues. REW doesn’t know or care about T/S parameters or whether or not they are stable. It is a measurement system. It measures what the actual behavior of your woofer/enclosure is whether or not T/S parameters are stable, or even if you bottom out the woofer.
Again, I think you are mixing measuring and modeling issues. REW doesn’t think or perform any modeling of loudspeaker response, it measures it. REW doesn't know or care what somebody's favorite modeling program says the response should be, it measures it. Stick a mic wherever you like, feed the signal to your computer and REW will provide the same information (and much, much more) as you would get if you fed the mic signal to your oscilloscope.Can anybody post: a picture from a scope of how a mic sees a BR box handling an impulse as well as how REW thinks it should look (as well as what the drive signal to the amp looks like, as good lab technique).
I'd like to limit my reply to the behaviour of a device made of rubber, cardboard, and starched linen after an impulse signal.You still seem to be mixing up modeling and measurement issues.
What REW does is store a sequence of bits along with some means of retrieving the signal it outputted for each instant. Then it looks up what kind of window and window slope the user likes and other factors relevant to the analysis model it is about to follow.
Some models - like pi - are pretty good. But I doubt the model that REW uses to suggest the impulse behaviour of that rubber, cardboard, and linen device is quite up to that standard. What I'm saying is that I don't trust the REW calculation (AKA a model) to produce a good replica of an impulse response. REW is not signalling an impulse and therefore not recording one. And all the more hesitation for something like MF output.
It would seem a simple matter for somebody to compare the REW impulse model with reality (which prolly takes a better 'scope than I own). Lab people are skeptics.
BTW, a DSP time delay is a swell tool for helping to compare input and output signals on an X/Y scope display.
Ben
Last edited:
Bolserst's reply directly above is correct.
This stuff has been developed and proven over many decades. The output signal is known. The waveform from the DUT is recorded. Math takes care of the rest. This is how audio measurement works regardless of the hardware / software. I would suggest reading up on impulse response more, if you think REW and by association virtually all audio measurement packages, are incapable of correctly reporting / recording waveforms as compared to an old analog scope.
This stuff has been developed and proven over many decades. The output signal is known. The waveform from the DUT is recorded. Math takes care of the rest. This is how audio measurement works regardless of the hardware / software. I would suggest reading up on impulse response more, if you think REW and by association virtually all audio measurement packages, are incapable of correctly reporting / recording waveforms as compared to an old analog scope.
If you want to know how many teeth are in a horse's mouth, you beseech the beast to open their mouth so you can count the teeth. You don't beat on your chest and insist your understanding is perfect and always will be.The waveform from the DUT is recorded. Math takes care of the rest.
REW does not test with an impulse whatever you may be implying in your reply. It records nothing but amplitude in a sweep. That's it. Then from that succession of amplitude numbers, it calculates phase, distortion, impulse picture, waterfalls, and other stuff, based on longer and more tenuous chain of assumptions (AKA models). Fourier was a great mathematician.
REW assumes the DUT (and my cheap mic, pre-amp, DAC, room, walls....) all have properties that reasonably match the model, it calculates phases, etc. Great stuff (and I contribute to REW every year or so and hope all readers will as well).
Frankly, I don't know how good REW is at guessing the impulse response. A quite imprecise result could still be helpful for some users or just ignored by BR builders. In the case of MF experimentation, you really want a good image of the cone motion, not a low quality calculated guess.
I'd like to see some empirical evidence in which a 'scope image is compared to the REW image. All I'm asking for is validation evidence.
What's the big problem with that? Just don't want to open the horse's mouth?
B.
Last edited:
Did you get a chance to look at the Farina paper I mentioned?
Based on your post, I’m guessing not. Shoot me an PM if you can’t locate a copy.
In simple terms, an exponential frequency sweep is fed to whatever device you want to measure…let’s say it’s a speaker. The response of the speaker to this sweep is captured and then convolved with a time reversed and exponentially scaled version of the sweep data that was output as the stimulus. The result of that convolution is the speaker's impulse response. Note that this math is performed in the time domain using the signals I mentioned previously can be viewed by clicking on the oscilloscope graph option. If you are unfamiliar with convolution, it is a very common mathematical operation in DSP. REW has a simple example on page 12 of the Help manual…or just enter it in your favorite search engine. (or better yet see free DSP book mentioned below)
Notice that the only pieces of data that are used for calculating the impulse response from the exponential sweep are the output stimulus(saved in memory), and the resulting response(captured and saved in memory). No models, no assumptions.
Once the impulse response has been determined Fourier and inverse Fourier transforms are performed as needed to move back and forth between the time domain and frequency domain to produce the method of viewing the impulse response data that the user is interested in. Fourier transforms are as basic a mathematical building block for DSP as addition and subtraction. There are no adjustments, settings, or tweaks available. (ie 1+1=2…every time) They are applicable to any data set whether it be response of a massive subwoofer, delicate ribbon tweeter, seismometer data from an earthquake, or hydrophone recording of whale songs. No models, no assumptions.
There is a free DSP book I would highly recommend you take a look at. It assumes very little previous knowledge, math is kept to a minimum, and where needed plenty of illustrations and plots supplement the simple formulas and explanations in the text. It was a big help to me when I first dipped my toe into the DSP pool.
Read on line here: The Scientist and Engineer's Guide to Digital Signal Processing's Table of Content
Download chapters or entire book here: The Scientist & Engineer's Guide to Digital Signal Processing, 1999 | Education | Analog Devices
If you can work your way thru the first 11 chapters you will have a much better understanding of what is going on under the hood of REW and other measurement software packages. You may even be inspired to continue reading the rest of the book to learn about how your Behringer DCX2496 works its magic.
BTW, don’t miss the bonus chapter Explaining Benford’s Law…fascinating stuff.
(Chapter 34, only available at the first link above)
The part I like about the Farina AES teaser is "The paper presents... an experimental verification in comparison with MLS." And the part I don't like is "$33".
About that "No models, no assumptions". Nobody is arguing with the math that convolutes the data stream (or at least few souls understands it enough to argue about it). But what if that rubber, cardboard, and starched linen device was not quite linear? Or had a slightly higher resonance when driven harder than the REW sweep used that time? Or if some bits of the cardboard had a mind of their own at certain loudness and frequency? Or the same questions about my cheap mic, old DAC, traffic noises?
That's the trouble with models and assumptions: we sometimes can't see 'em.
B.
Ben,1)But what if that rubber, cardboard, and starched linen device was not quite linear?
2)Or had a slightly higher resonance when driven harder than the REW sweep used that time?
3)Or if some bits of the cardboard had a mind of their own at certain loudness and frequency?
4)Or the same questions about my cheap mic, old DAC, traffic noises?
5)That's the trouble with models and assumptions: we sometimes can't see 'em.
B.
1) They never are, why do you ask?
2) See answer to #1.
3) See answer to #2.
4) One always must verify the test gear and environmental influences before making ASSumtions.
5)Although we sometimes can't see models, we can easily see trolls, you seem to even troll your own posts, hope it gives you enjoyment watching the water under the bridges ;^)
Cheers,
Art "Titanium Cranium" Welter
- Home
- Loudspeakers
- Subwoofers
- Commercial motional feedback woofer available sort of