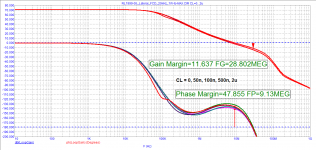
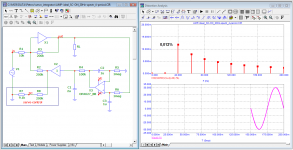
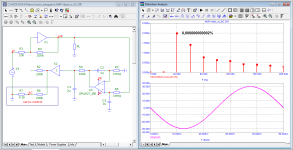
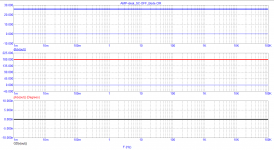
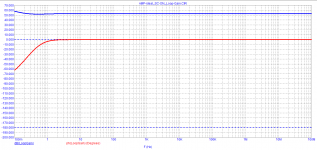
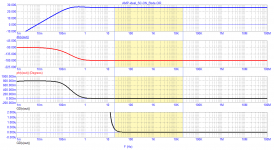
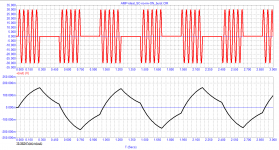
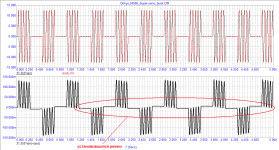
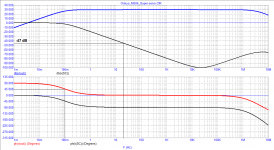
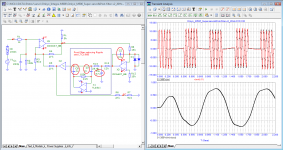
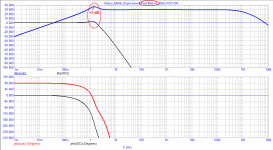
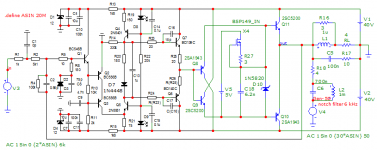
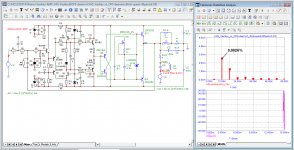
I decided to check what the 1999 design amplifier would be like if the output stage were made on laterals. That's what came out of it
Attachments
-
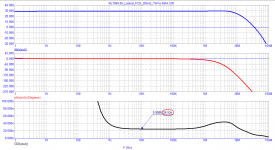 RL1999-05_Lateral_Bode.png25.6 KB · Views: 261
 -
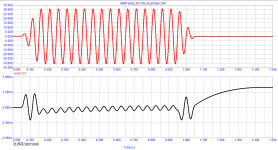
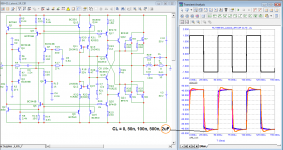 RL1999-05_Lateral_20kHz_square.png75.4 KB · Views: 127
 -
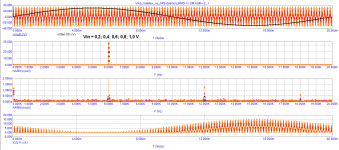
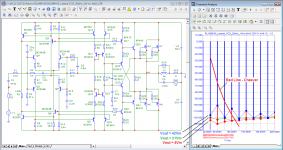 RL1999-05_Lateral_FCD_20kHz_1W-to-MAX.png101.8 KB · Views: 122
 -
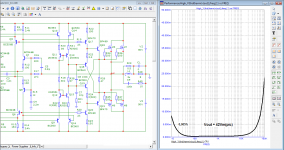 RL1999-05_Lateral_THD_vs_Freq_(2-period).png91 KB · Views: 101
 -
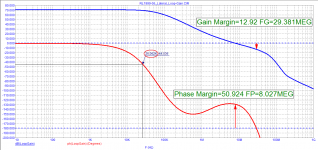
 RL1999-05_Lateral_Loop-Gain_C-Load.png41.6 KB · Views: 245
 -
 RL1999-05_Lateral_Loop-Gain.png54.4 KB · Views: 250
Who has done photography will understand.
Take a picture with a slow shutter speed, say 1 second and the corresponding aperture of the film:
- from a tripod using a cable;
- and a few handheld shots.
You will find that the quality of each image is different. Moreover, the best resolution of the picture from a tripod, you can see the smallest details of the landscape.
The quality of hand-held shots is different, the general only rendering of the outlines of large objects, small details are either absent altogether, or strongly smeared, depends on camera vibrations during the exposure time.
Oscillations of the camera during exposure are analogous to transients in amplifiers. Transient processes are connected with the reactive elements of the circuits: capacitances (dynamic capacitance of active elements, including Miller capacitor; mounting capacities, etc.), inductance.
This is a direct analogy with the work of amplifiers covered by general NFB. The transmission of microdynamics depends not only on the signal transit delay time, but also on the behavior of the group delay far beyond the audio range.
In fact, the processes associated with the work of NFB are much more complicated, which Graham_Maynard tried to convey.
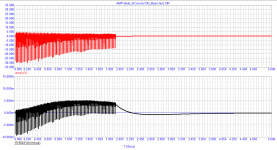
servo control operation
Attachments
-
 08_AMP-ideal_SC-ON_burst-fade_vector-error.png28.7 KB · Views: 56
 -
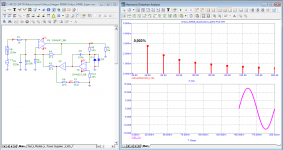
 07_AMP-ideal_SC-ON_20Hz-FCD.png46 KB · Views: 68
 -
 06_AMP-ideal_SC-ON_4-period_20Hz-spectr.png46.5 KB · Views: 59
 -
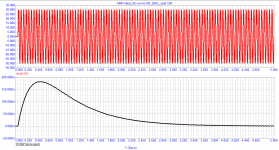
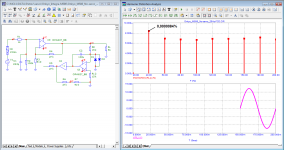
 05_AMP-ideal_SC-OFF_20Hz-FCD.png45.5 KB · Views: 313
 -
 04_AMP-ideal_SC-OFF_Bode.png18.3 KB · Views: 319
 -
 02_AMP-ideal_SC-ON_Loop-Gain.png23.9 KB · Views: 333
 -
 03_AMP-ideal_SC-ON_Bode.png25.2 KB · Views: 326
 -
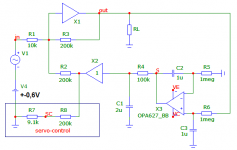 01_AMP-ideal_SC_SCH.png11.1 KB · Views: 332
 -
Servo-control_bilingva.pdf424.4 KB · Views: 52
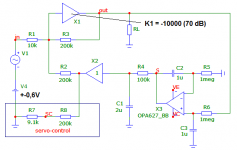
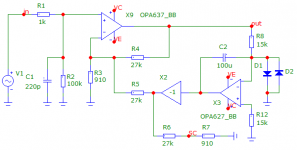
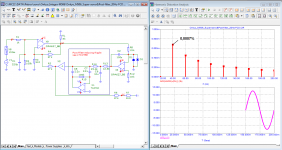
When the developers still understood how the servo control system should work, they did it like this. An op amp of the OPA637 type was used as an "ideal" amplifier. I do not give a description, as I see that the overwhelming majority of visitors are only interested in drawings.
Attachments
-
 08_Onkyo_M506_No-servo_20Hz-FCD.png63.1 KB · Views: 55
 -
 07_Onkyo_M506_Super-servo_20Hz-FCD.png63.8 KB · Views: 62
 -
 06_Onkyo_M506_Super-servo_20Hz-Burst.png39.3 KB · Views: 54
 -
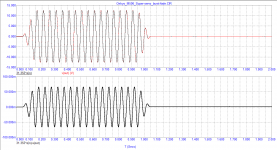 05_Onkyo_M506_Super-servo_20Hz-Burst-Fade.png26.6 KB · Views: 54
 -
 04_Onkyo_M506_Super-servo_20Hz-square.png55.8 KB · Views: 53
 -
 03_Onkyo_M506_Super-servo_20Hz.png77.6 KB · Views: 59
 -
 02_Onkyo_M506_Super-servo_Bode.png30.1 KB · Views: 92
 -
 01_Onkyo_M506_(Super-servo-SCH).png13.9 KB · Views: 85
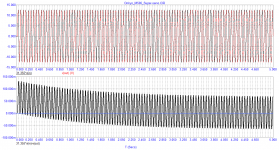
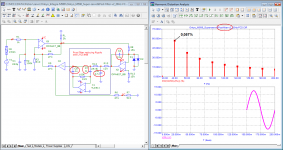
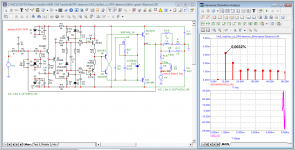
Increasing the speed of the servo control system with a post filter increases the distortion
Attachments
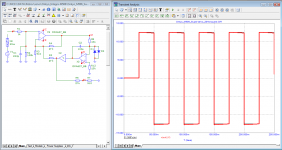
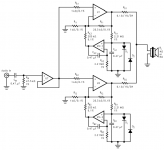
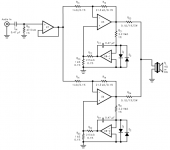
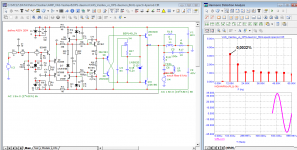
Amplifier options 100 W on the popular LM3886 IC based on circuits from AN-1192 TI
I would like to draw your attention to the following facts:
1. the presence of a buffer at the input provides a low and stable signal source resistance for the LM3886, which guarantees the minimum possible delay for these microcircuits;
2. the absence of a radio-frequency filter at the input, which also increases the delay time for the amplifier as a whole
3. Using servo control to reduce parasitic currents between the outputs of paired microcircuits
4. the integrator signal is attenuated by more than 200 times (about 50 dB) and has little effect on the signal in the audio band
Attachments
The overwhelming majority of manufacturers adhere to the rule that the output of a non-inverting amplifier is designated as "+" and general as "-", and vice versa in inverting ones. Although, strictly speaking, it is difficult to expect that the same holds true in recordings with modern processing and mixing methods.
Somewhere I met information that the cilia in the inner ear of a person generate an electrical impulse only when moving in one direction, that is, a person's hearing responds to one half-wave of the signal (the cilia work in one direction - to pressure, but they no longer work for rarefaction). Thus, if the phonogram contains clearly expressed fragments with signal asymmetry in some spectral regions, then a change in polarity can give a tangible result. A tangible result can be with acoustics with a pronounced 2nd harmonic, we will get about the same result, but not the fact that the sound will be improved with a real absolute phase. It turns out that about half of the listeners do not react to the phase change, and those that do react are not the fact that they react correctly.
In general, a rather controversial issue. The only thing that is important in my opinion is to adhere to the correct labeling of the terminals of both amplifiers and acoustics. Then, when several systems are connected in parallel, they will work in phase without preliminary checking (and eliminating the error, if any).
Measuring the output impedance of an amplifier
(...)
3.The third method is often used in both hardware and simulators. As in the second method, the amplifier input is shorted to ground. At the output of the amplifier, between the load (Rl = 8 ohm) and ground, a voltage source is switched on with an amplitude of approximately ¾ of the supply voltage and the voltage at the output of the amplifier is measured. When measuring real amplifiers, use the second channel of the stereo amplifier. The output impedance is calculated using the formula: Rout = Rl * Vout / (Vin-Vout)
This method is not very useful because the interesting part of the output impedance is the non-linear part and this does not measure it.
A method I have used is this:
The amplifier under test (DUT) has it input shorted.
I use a stereo amp. One channel outputs +/-24V 20Hz sinus, it is coupled into the output of the DUT with a 24R resistor, so it gets +/- 1A.
The second channel outputs +/-1V 48kHz sinus, it is also coupled into the DUT output via a resistor of higher value, for example 1k, so it produces an AC current of 1mA. This current should be pretty low.
The output of the DUT is acquired through a highpass filter that gets rid of the 20Hz tone, and the amplitude and phase of the 48kHz tone is detected with a soundcard.
This gives the output impedance of the amp at 48kHz versus the low frequency current in the output stage.
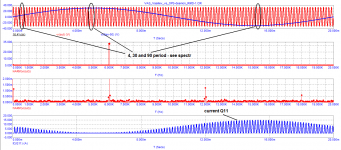
Here is an example, each curve is one period of the low frequency signal, they are vertically offset for readability. At the start of the test, the DUT output is cold, so it is a bit underbiased, then it heats up and shows gm-doubling.

I got a lower noise soundcard and I'm doing a board with support hardware to do more of this kind of tests.
No-one cares about the damping factor as long as output impedance is lower than that of the speaker wires, which is easy. What matters is that output impedance is constant with varying output current.
I don't remember the numbers from this particular measurement, but that's a convenient way to measure crossover/switching distortion.
Crossover/switching distortion depends only on output current because it is a large signal phenomenon in output stage. It does not depend much on output voltage, unless close to clipping.
So, if an amplifier outputs 8 Vpp into 8R resistive load, so 1App current, the crossover distortion will be about the same as if you inject a 1App current in the output while the input is shorted. But in the latter case the output signal is much smaller, there is no need for notch filter to get rid of fundamental, instead the distortion appears at the output directly.
So, for example, the plot I posted shows 0.25% change in amplitude of 10kHz HF signal during a LF current period. I did not write down the value of the resistor I used to inject the HF signal, but I think it was around 100R. If the 10kHz signal was injected through a 100R resistor and its amplitude varies 0.25%, it means the output impedance of the amp at 10kHz varies by 0.25 ohms over the range of output current. Since the output impedance of the amp forms a voltage divider with the load, over a 8R load this translates to about 3% distortion. This is a pretty bad sounding amp.
there is a method for measuring reversible intermodulation distortion proposed by Hiraga
Attachments
-
 VAS-Vasiliev_vs_OPS-deemon_RIMD-1_SCH.png30.9 KB · Views: 202
 -
 VAS-Vasiliev_vs_OPS-deemon_RIMD-1.png43.1 KB · Views: 198
 -
 VAS-Vasiliev_vs_OPS-deemon_6kHz_4period-spectr.png87.9 KB · Views: 190
 -
 VAS-Vasiliev_vs_OPS-deemon_6kHz_30period-spectr.png81.7 KB · Views: 189
 -
 VAS-Vasiliev_vs_OPS-deemon_6kHz_90period-spectr.png86.4 KB · Views: 198
That would give much less information because the amplitude of the HF signal is very high, so it does not reveal the small signal variations of output stage impedance versus current...
The board that will allow me to experiment with this is almost finished in Altium, there will be more...
The board that will allow me to experiment with this is almost finished in Altium, there will be more...
nothing prevents you from setting a step-by-step change in the signal level
Much lower distortion at lower RF levels
I'm not measuring distortion, I'm measuring the amplitude of the HF signal only.
Measuring its distortion would not give any useful information, and it would also be difficult, since other elements in the chain could add to the distortion, whereas it is pretty unlikely that a component in the measurement chain would introduce a time-varying change in amplitude of a steady state signal.
- Home
- Amplifiers
- Solid State
- Musings on amp design... a thread split