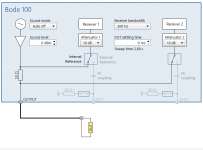
This is using the internal 50 Ohms on the Bode 100 and the Bode as an impedance measuring system. its a standard configuration for their software. The down side its that the max with accuracy is in the 10K Ohm range. I will look for documentation on their fixtures to see if I can duplicate them.
Attachments
1audio
Can you tell us the input impedance of your measurement system.
I have modelled the transformer with a secondary winding resistance, the secondary leakage inductance, and secondary winding capacitance.- just three parameters
R=9200 ohms
L =1.4 H
C = 135 pF
The parameters include the primary resistance, leakage inductance and winding capacitance reflected from the primary side.
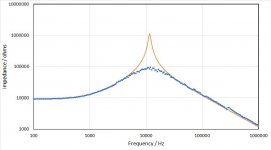
My model matches your data quite well (see picture) except that the modelled peak is higher than the measurements by quite a bit, so I wonder if there is a some resistance somewhere else. Also the capacitance is higher than I was expecting.
Can you tell us the input impedance of your measurement system.
I have modelled the transformer with a secondary winding resistance, the secondary leakage inductance, and secondary winding capacitance.- just three parameters
R=9200 ohms
L =1.4 H
C = 135 pF
The parameters include the primary resistance, leakage inductance and winding capacitance reflected from the primary side.
My model matches your data quite well (see picture) except that the modelled peak is higher than the measurements by quite a bit, so I wonder if there is a some resistance somewhere else. Also the capacitance is higher than I was expecting.
Attachments
OK, read back over the previous posts and found the 100 k loading the secondary.
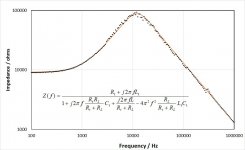
Updated model for the magnitude has the parameters (see equation in picture)
Rt = 9200
Lt=1.4 H
Ct=135 pF
RL = 85k
The output impedance of transformer is Rt and Lt in series loaded by the parallel combination of the winding capacitance and the 100 k (85k fits better than 100k).
Now it looks better. Capacitance still looks high - ought to be about 30 pF - perhaps due to 100 pF (about 1 m) of coaxial cable?
Shorting the primary and measuring the impedance of the unloaded secondary versus frequency seems to be the best way to measure the transformer parameters.
Attachments
Keep in mind I was measuring one transformer, not both.
I just tried to measure inductance with limited success. The secondary is out of range for my bridge it seems. I'll dig out the manual and look for tricks.
The shorted secondary also yields some odd results probably because it's above resonance.
Primary measurements (transformer only)
secondary open, primary
50 Hz 145 uH, .648 Ohm
1 KHz 107 uH .652 Ohm
10 KHz 107 uH .845 Ohm
20 KHz 110 uH 1.39 Ohm
Secondary shorted, Primary
50 Hz 87 mH 6.9 Ohms
1 KHz 28.9 mH 396 Ohms
10 KHz 480 uF 3 Ohms
20 KHz 1.4 uF 1.8 Ohms
Keep in mind I was measuring one transformer, not both.
I just tried to measure inductance with limited success. The secondary is out of range for my bridge it seems. I'll dig out the manual and look for tricks.
The shorted secondary also yields some odd results probably because it's above resonance.
Primary measurements (transformer only)
secondary open, primary
50 Hz 145 uH, .648 Ohm
1 KHz 107 uH .652 Ohm
10 KHz 107 uH .845 Ohm
20 KHz 110 uH 1.39 Ohm
Secondary shorted, Primary
50 Hz 87 mH 6.9 Ohms
1 KHz 28.9 mH 396 Ohms
10 KHz 480 uF 3 Ohms
20 KHz 1.4 uF 1.8 Ohms
Hi Demian,
You must have switched the open and shorted results.
Steve measured a primary inductance around 250mH and a leakage inductance when secondary shorted of 99uH
Even then, I’m surprised by the large difference in primary inductance 250mH versus 87mH.
The leakage inductances on the other hand are quite close, 99uH versus 145uH.
Analyzing your CSV files, will give us additional info. I’ll come back on that today.
Hans
Yes, I did swap the measurements. The ESI videobridge I used has a 1V source and internal resistors so the actual voltage on the transformers varies.
The first measurements with Praxis used around 2V RMS through a 100 Ohm resistor. The ones with Bode use its internal 1V source. If I can fit it in I'll do some with a higher excitation level today. I'll alos check with some standards to confirm the accuracy of the measurements.
The first measurements with Praxis used around 2V RMS through a 100 Ohm resistor. The ones with Bode use its internal 1V source. If I can fit it in I'll do some with a higher excitation level today. I'll alos check with some standards to confirm the accuracy of the measurements.
The CSV files you provided are from impedance measurements.
It is a bit hard to translate this into inductance and capacitance curves.
But even more restricting is that the measurent is beginning at 100Hz.
This should be no higher than 10Hz, or it will not be possible to reconstruct the inductance.
See impedance and inductance from your first file with "primary / secondary open" in the first two images.
The last LTSpice image has impedance and inductance in one image, showing that inductance becomes stable around 10Hz, but the similarities between the measured and simulated images are starting to get under control.
So my request to you is to repeat the Bode 100 measurements, but now with CSV files holding frequency from 10Hz to at least 100Khz plus gain and phase and not the impedance and phase .
This is in fact receiver1/receiver2 and the phase between them.
From thereon I can compute all data.
As shown in Steve's graph's it would also be illustrative to have measurements at a number of different levels, like 0.5, 1 and 2 Volt.
Hans
Attachments
More data. The CSV files are really too big (2+MB) to upload. I may need to redo them with lower resolution if the software will let me, or I could send directly if you PM your e-mail to me. Or I can send the Praxis files and you can install Praxis (free) and use its analysis tools to pull data.
These were made with Praxis and using a power amp to drive the measurements. The impedance measurements were made with 1 Ohm in series for sampling the current.
I discovered that more than about 12V RMS will cause an arc so no more than that. Not sure what is arcing but the speaker is not mine so I'm not going further. . .
Also I made a quick HV divider with 10Meg in series with each lead on the transformer and adjusted it to give an X1000 for the measurement. Needless to say its pretty sensitive to stray coupling. I'll need to build it into a proper shielded box to control that.
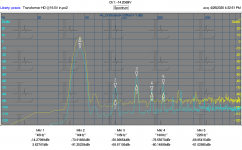
Plot 1 is level & HD using a Farina Chirp
Plot 2 is the response at the highest level before arcing
Plot 3&4 are 45Hz harmonic spectrum. Yellow is drive and Teal is output of transformer. two drive levels.
Plots 5-8 are impedance plots at different drive levels.
These were made with Praxis and using a power amp to drive the measurements. The impedance measurements were made with 1 Ohm in series for sampling the current.
I discovered that more than about 12V RMS will cause an arc so no more than that. Not sure what is arcing but the speaker is not mine so I'm not going further. . .
Also I made a quick HV divider with 10Meg in series with each lead on the transformer and adjusted it to give an X1000 for the measurement. Needless to say its pretty sensitive to stray coupling. I'll need to build it into a proper shielded box to control that.
Plot 1 is level & HD using a Farina Chirp
Plot 2 is the response at the highest level before arcing
Plot 3&4 are 45Hz harmonic spectrum. Yellow is drive and Teal is output of transformer. two drive levels.
Plots 5-8 are impedance plots at different drive levels.
Attachments
-
 Quad transformer primary impedance secondary open 5V drive.PNG78.6 KB · Views: 67
 -
 Quad transformer primary impedance secondary shorted 5V drive.PNG70.9 KB · Views: 77
 -
 Quad transformer primary impedance secondary shorted 2.PNG70.5 KB · Views: 63
 -
 Quad transformer primary impedance secondary open 2.PNG78 KB · Views: 70
 -
 Quad transformer Transformer HD 45 Hz 16.PNG72.1 KB · Views: 59
 -
 Quad transformer Transformer HD 45 Hz 300mV.PNG80.8 KB · Views: 55
 -
 transformer response secondary terminated with 20 Meg.PNG69.7 KB · Views: 49
 -
 transformer response and distortion -chirp 260V rms.PNG76.9 KB · Views: 70
Hi Demian,
I'll stick to the Bode 100 images.
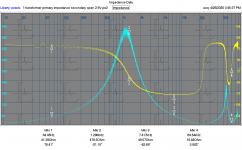
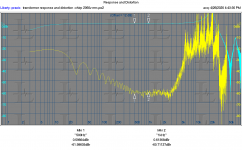
In the image below from top to bottom, you see resp 1) the expected shapes of impedance and phase,2) the results from your Bode and 3) results from your Praxis.
To start with the Praxis: the peak at 480 Ohm @ 1.2Khz, corresponds in no way with the Bode showing 55 Ohm @ 450 Hz although both should be the same.
Above 50 Khz, the Praxis shows rubbish, where the Bode is noisy but relatively accurate up to 1 Mhz.
All in all, Praxis results for impedance measurements are unreliable and shouldn't be used.
That leaves us with the Bode 100, where you already made the 4 necessary recordings starting from 100Hz.
I will try to interpolate these curves down to 10 Hz.
But if possible, it would be a great help if you could redo the CSV files for freq/gain/phase instead of freq/imp/phase.
And up to 100 Khz will be adequate.
Gain is FR divided by the level of the source signal.
Hans
I'll stick to the Bode 100 images.
In the image below from top to bottom, you see resp 1) the expected shapes of impedance and phase,2) the results from your Bode and 3) results from your Praxis.
To start with the Praxis: the peak at 480 Ohm @ 1.2Khz, corresponds in no way with the Bode showing 55 Ohm @ 450 Hz although both should be the same.
Above 50 Khz, the Praxis shows rubbish, where the Bode is noisy but relatively accurate up to 1 Mhz.
All in all, Praxis results for impedance measurements are unreliable and shouldn't be used.
That leaves us with the Bode 100, where you already made the 4 necessary recordings starting from 100Hz.
I will try to interpolate these curves down to 10 Hz.
But if possible, it would be a great help if you could redo the CSV files for freq/gain/phase instead of freq/imp/phase.
And up to 100 Khz will be adequate.
Gain is FR divided by the level of the source signal.
Hans
Attachments
Demian,
I’m a bit surprised by the noisy Bode 100 images.
Reading the specs, I see that the inputs can either be 50 Ohm, or 1 Meg // 40 to 55 pF.
In our case the hi impedance input should be used, right ?
But when later analyzing the data, I should correct for this input capacitance.
The other thing I noticed is that with a source generating 1Volt, the receiver should attenuate 20 dB to prevent oversteering, is this what you did ?
Hans
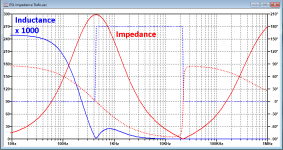
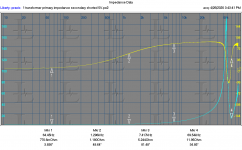
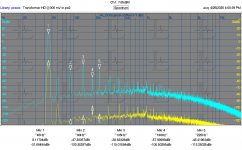
The Bode plots are using the config I posted as a single port impedance plot. source Z 50 Ohms with a short cable and two clip leads connected to the transformer primary.
I have no idea why the numbers are all different. The praxis has been giving accurate data when i check with my standards.
I'll plot the through parameters with the Bode today and see what it says. The transformer secondary seems to be very sensitive to stray capacitance in my measurements.
I have no idea why the numbers are all different. The praxis has been giving accurate data when i check with my standards.
I'll plot the through parameters with the Bode today and see what it says. The transformer secondary seems to be very sensitive to stray capacitance in my measurements.
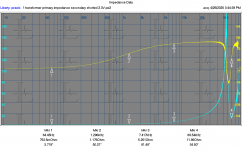
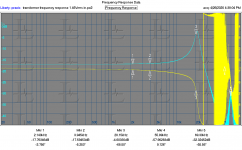
Here are more measurements using the Bode. I figured out how to get the plot down to 10 Hz. I have not used this in several years and the software is majorly revised so I'm still learning.
You have the through response and a transmission/reflection measurement from 10 Hz to 1 MHz.
You have the through response and a transmission/reflection measurement from 10 Hz to 1 MHz.
Attachments
Somehow I became unsubscribed to this thread, looks like I have missed a lot of goings on!
@1audio,
Glad to see somebody else taking a crack at measuring the ESL63 transformer and delay line.
As you mentioned a couple times, measurement of high impedance(high leakage inductance, low winding capacitance) step up transformers can be tricky, needing carefully understanding of the load the measurement gear is applying to the DUT. I'll add another post outlining some methods I have found to work well.
I have no experience with the Bode 100, so can’t offer much help there, but can provide some suggestions for using Praxis.
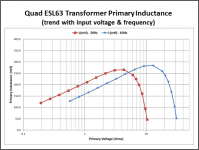
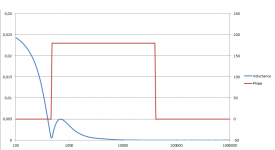
For open secondary impedance measurements with Praxis, it is difficult get good LF information or level trending using Farina Chirp or MLS, especially with increasing input voltages. I believe the reason is that both signals induce transitory DC offsets in the core magnetization which changes the core permeability and resulting primary inductance. For clean impedance data, use the “Stepped Tones(2ch asynch)” stimulus option. Attached is an example(not ESL63) showing impedance for a range of input levels from 0.1Vrms to 6.4Vrms in 6dB steps. Notice that not only does the primary inductance change, but the core losses that define the magnitude of the impedance peak as well.
For measuring the transformer response using the Praxis “balanced” probe, you already noticed that it’s low input impedance of ~100K can severely damp the HF resonance behavior. Adding 1Meg in series with each line works well. Getting too high of an input impedance and you start running into noise issues. The other thing to be aware of, is that the probe(at least with the setup I used) has poor rejection of common mode signals especially at HF and/or low impedance. Often you will find if you swap the probe leads you will get a different response when it should be the same only inverted phase. The correct response is usually about half-way between the two. A proper high-Z instrumentation input or transformer coupled input is needed in some cases.
@1audio,
Glad to see somebody else taking a crack at measuring the ESL63 transformer and delay line.
As you mentioned a couple times, measurement of high impedance(high leakage inductance, low winding capacitance) step up transformers can be tricky, needing carefully understanding of the load the measurement gear is applying to the DUT. I'll add another post outlining some methods I have found to work well.
I have no experience with the Bode 100, so can’t offer much help there, but can provide some suggestions for using Praxis.
For open secondary impedance measurements with Praxis, it is difficult get good LF information or level trending using Farina Chirp or MLS, especially with increasing input voltages. I believe the reason is that both signals induce transitory DC offsets in the core magnetization which changes the core permeability and resulting primary inductance. For clean impedance data, use the “Stepped Tones(2ch asynch)” stimulus option. Attached is an example(not ESL63) showing impedance for a range of input levels from 0.1Vrms to 6.4Vrms in 6dB steps. Notice that not only does the primary inductance change, but the core losses that define the magnitude of the impedance peak as well.
For measuring the transformer response using the Praxis “balanced” probe, you already noticed that it’s low input impedance of ~100K can severely damp the HF resonance behavior. Adding 1Meg in series with each line works well. Getting too high of an input impedance and you start running into noise issues. The other thing to be aware of, is that the probe(at least with the setup I used) has poor rejection of common mode signals especially at HF and/or low impedance. Often you will find if you swap the probe leads you will get a different response when it should be the same only inverted phase. The correct response is usually about half-way between the two. A proper high-Z instrumentation input or transformer coupled input is needed in some cases.
Attachments
Last edited:
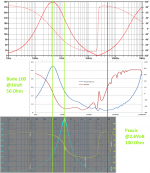
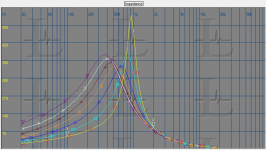
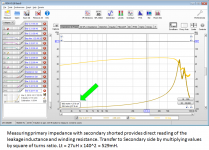
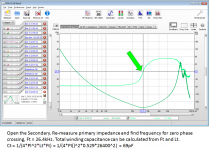
One way to measure transformer windings and parasitics:
The most stable/repeatable way I found to measure primary and secondary DC resistances independently, was with a DC bench supply, reference resistor, and DVM. Make a series circuit with the winding of interest and a reference resistor. Then measure the DC voltage across reference resistor and DC voltage across the winding. Then calculate the winding resistance based on measured voltages and the one known resistance. For most ESL step-up transformers, a 1Kohm reference resistor works well for the secondary, a 10 ohm for the primary.
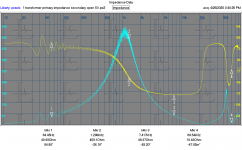
A similarly simple DVM measurement can be used to determine the step-up ratio. Drive the primary with a stable 100Hz – 200Hz signal, and measure the AC voltage at the primary and secondary windings. The winding ratio is simply the ratio of those measurements . The 10Meg input impedance of the DVM insures minimal loading of the secondary. (BTW, your Bode 100 response measurement(Post #134) with 1Meg input impedance matches my estimate of ~1:122 step-up ratio, although I don’t understand why the response peaks at 4Khz and then rolls off. That would imply a ~1000pF load from the measurement setup which seems unlikely.)
For determining the leakage inductance, measure the primary impedance with the secondary shorted. Pick a frequency where the phase has increased beyond 45deg so you will have a good representation of the inductance. Your shorted secondary Praxis measurements in Post#130 are in good agreement with your bridge measurements in Post #124, showing total leakage inductance reflected to the primary of about 110uH. That is a little higher than what I measured, but within manufacturing tolerance I would think. This value can be reflected to the secondary by multiplying it by the square of the step-up ratio; about 1.64H.
For determining the winding capacitance, measure the primary impedance with the secondary open. Note the resonance frequency (min impedance/zero phase crossing). Use this frequency and the leakage inductance you determined in previous step to calculate the winding capacitance; about 30pF using the open secondary impedance measurement from Post #130.
(Pics of example measurements and calculations of parasitics attached.)
If winding configuration is more complicated (with interleaving for example), you may find multiple peaks and dips with zero phase crossings in the HF region. In this case, add a known capacitance across the secondary winding to move the resonance down into a more stable range. The added capacitance can then be subtracted from the calculated total capacitance to get the winding capacitance.
One thing I forgot to measure on the ESL-63 transformer was the winding to winding capacitance. To do this, short the primary winding and secondary winding. Then, measure the capacitance with an LCR meter or bridge between the shorted primary and shorted secondary.
The most stable/repeatable way I found to measure primary and secondary DC resistances independently, was with a DC bench supply, reference resistor, and DVM. Make a series circuit with the winding of interest and a reference resistor. Then measure the DC voltage across reference resistor and DC voltage across the winding. Then calculate the winding resistance based on measured voltages and the one known resistance. For most ESL step-up transformers, a 1Kohm reference resistor works well for the secondary, a 10 ohm for the primary.
A similarly simple DVM measurement can be used to determine the step-up ratio. Drive the primary with a stable 100Hz – 200Hz signal, and measure the AC voltage at the primary and secondary windings. The winding ratio is simply the ratio of those measurements . The 10Meg input impedance of the DVM insures minimal loading of the secondary. (BTW, your Bode 100 response measurement(Post #134) with 1Meg input impedance matches my estimate of ~1:122 step-up ratio, although I don’t understand why the response peaks at 4Khz and then rolls off. That would imply a ~1000pF load from the measurement setup which seems unlikely.)
For determining the leakage inductance, measure the primary impedance with the secondary shorted. Pick a frequency where the phase has increased beyond 45deg so you will have a good representation of the inductance. Your shorted secondary Praxis measurements in Post#130 are in good agreement with your bridge measurements in Post #124, showing total leakage inductance reflected to the primary of about 110uH. That is a little higher than what I measured, but within manufacturing tolerance I would think. This value can be reflected to the secondary by multiplying it by the square of the step-up ratio; about 1.64H.
For determining the winding capacitance, measure the primary impedance with the secondary open. Note the resonance frequency (min impedance/zero phase crossing). Use this frequency and the leakage inductance you determined in previous step to calculate the winding capacitance; about 30pF using the open secondary impedance measurement from Post #130.
(Pics of example measurements and calculations of parasitics attached.)
If winding configuration is more complicated (with interleaving for example), you may find multiple peaks and dips with zero phase crossings in the HF region. In this case, add a known capacitance across the secondary winding to move the resonance down into a more stable range. The added capacitance can then be subtracted from the calculated total capacitance to get the winding capacitance.
One thing I forgot to measure on the ESL-63 transformer was the winding to winding capacitance. To do this, short the primary winding and secondary winding. Then, measure the capacitance with an LCR meter or bridge between the shorted primary and shorted secondary.
Attachments
Last edited:
Here is some more data I have collected:
Primary to secondary C:
100 Hz 1.2nF (284K esr)
1 KHz 842pF (34K esr)
10 KHz 678 pF (3k esr)
Attached are the files from the Bode tester (you can download the software here Bode 100 Download Area | OMICRON Lab | You do not need the hardware to open the files and export CSV or pictures.
The Bode uses two different setups for low impedance and high impedance which is why I have two separate tests of a network.
In the zip files are:
Primary with secondary shorted, open and with 100 pF
Secondary with primary open and shorted
Test files of 250 Ohms in parallel with 4 Ohms and 1.5uF and my 10H GR standard (which measures 10.002H)
Attachments
Here is some more data I have collected:
Primary to secondary C:
100 Hz 1.2nF (284K esr)
1 KHz 842pF (34K esr)
10 KHz 678 pF (3k esr)
Attached are the files from the Bode tester (you can download the software here Bode 100 Download Area | OMICRON Lab | You do not need the hardware to open the files and export CSV or pictures.
The Bode uses two different setups for low impedance and high impedance which is why I have two separate tests of a network.
In the zip files are:
Primary with secondary shorted, open and with 100 pF
Secondary with primary open and shorted
Test files of 250 Ohms in parallel with 4 Ohms and 1.5uF and my 10H GR standard (which measures 10.002H)
Demian,
This is great, having the recordings in combination with the BAS software.
Do you remember that I did not understand your measurement of the secondary in posting #114 and that it looked as if you had inserted a 1nF cap ?
Now knowing that the interwinding capacitance has this value of arounf 1nF, it seems that you had the primary side not floating but connected to gnd.
In your current measurements this seems to be corrected.
I will try yo convert this data in the resp. 9 different transformer inductances, capacitances and resistances and in the transformer ratio.
When this all is looking o.k., I will try to find the Hc, Br and Bs values to complete the model.
Hans
One more set of numbers-Turns ratio measurement
Secondary- 10.0321V 2400 Kz (approx 10,000 turns)
Primary .080075V (approx 40 turns)
3 turns added .005850 (3 turns)
Unless some more info is needed I'll be reassembling the bottom of this speaker and moving it back into temp storage tomorrow.
Secondary- 10.0321V 2400 Kz (approx 10,000 turns)
Primary .080075V (approx 40 turns)
3 turns added .005850 (3 turns)
Unless some more info is needed I'll be reassembling the bottom of this speaker and moving it back into temp storage tomorrow.
- Home
- Loudspeakers
- Planars & Exotics
- QUAD 63 (and later) Delay Line Inductors