I forgot to say that the Tweeter LR4 highPass was at 1KHz rather than 2KHz to see more of its response further away from the XO freq and not being affected by the filter
Well, you're not making things easier.

Please learn to use target response overlay in ARTA! -> Overlay/Generate target response
We can check, but then you need to disable the xo filters, or use an even lower filter like 500Hz or so.I thought we were going to check the natural slopes of drivers first?
But natural roll-off checking can be abandoned if you use target response with the 2kHz LR4 filter.
Last edited:
Well is the tweeter measurement good enough for analisis?
Not enough.
Would be best without xo filter (or a low filter) and relative low in level (to avoid damage).
Off-axis responses would be useful.
Last edited:
Remember that we are only dealing with the on-axis frequency response now. Not at all sure the 2kHz crossing will work fine, here I think of the tweeter as a potential problem. Not all tweeters like this low xo, not even expensive ones. Focal uses 2.5-3Khz xo usually.
So it would be nice to have a flat starting point so that it is easy to apply other xo filters later.
So it would be nice to have a flat starting point so that it is easy to apply other xo filters later.
Last edited:
Looks reasonably flat, but we can't see the relative driver frequency and phase responses from that.And what about the Farfield, all drivers with LR4 XO's your shelving filters Woofer and tweeter and Woofer gain reduced?
This is not a zig zag. It is running downward continually, getting more steep at the right end of the graph. It keeps wrapping back upward to fit on the screen.Can anyone explain how to read the Phase graph I attached Post Nº 48? It is all zig zag whereas I presumed it should be a straight Line?
And what do you consider far field? Is it far enough to incorporate baffle effects (intended anomalies), or room effects (eg unintended anomalies)?And what about the Farfield,
There has been mention of off-axis measurements. This is a way to answer all kinds of questions and produce a clear result. A crossover done this way is beyond the apparent scope of this thread,.. but specific questions could definitely be asked. Just having some off-axis measurements 'just for the sport of it' won't help.
This is not a zig zag. It is running downward continually, getting more steep at the right end of the graph. It keeps wrapping back upward to fit on the screen.
What Allen said.
In ARTA, when viewing the FR and phase (which is "zig-zagging"), click "view" on the top left and from the drop-down menu check the "minumum phase" option.
What delay = one cycle?
Can anyone explain how to read the Phase graph I attached Post Nº 48? It is all zig zag whereas I presumed it should be a straight Line?
I recommended before to you that you show minimum phase when using ARTA. What you are showing now is the total phase.
Delay is the same thing as phase lag/rotation. So when you measure the output of a driver from some distance away, the phase includes both the phase changes from the driver's own response PLUS the phase lag from the delay that results from the small amount of time it takes for sound to travel from the driver to the mic.
If you only want to see the phase from the driver itself, you can:
A. Select "minimum phase" from the menu in ARTA that determines what is shown on the screen
B. In ARTA, there is a way to manually enter an estimated "group delay", which is then subtracted out. You can play with the amount of group delay that is subtracted until all the "zig zags" are eliminated, or most of them at least
I usually choose option (A) for all my measurements. This is especially true when you are doing nearfield measurements and can use a very long time window, and therefore get very good low frequency data. When you are doing far-field measurements and can only get e.g. 200Hz resolution because you must gate the time domain response after only 5 msec or so, the minimum phase will not be very accurate at low frequencies. But for nearfield measurements, choose door # A...
This is probably the 'correct' way to do this. There may be other not related non-minimum phase aspects to the measurement."group delay", which is then subtracted out..
This is not a zig zag. It is running downward continually, getting more steep at the right end of the graph. It keeps wrapping back upward to fit on the screen.
+1 on that.
What you see as a "zig zag" is just the requirement to represent the total phase lag within the boundaries of -180deg to +180deg. When the phase "falls" (lags) below -180deg, 360 degrees are added on and the line appears again at the top of the plot. In reality the phase is continually decreasing, or "running downhill".
It's convention to only plot phase within these boundaries. You can also think of the phase angle in this way:
Think of a circle.
Now envision that you are looking at the end of a perfectly straight pipe or tube end-on. In this perspective it looks like a circle.
Envision that, with time, a dot is moving into the pipe, away from the end. Instead of traveling straight down the middle of the pipe, it is moving in a helical path along the wall of the pipe, like this:
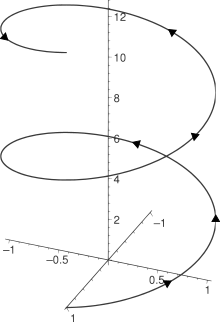
The position in time of such a movement, as viewed from the end of the pipe where the pipe looks like a circle, is a point moving around the circle. You cannot see the "distance away" because of your perspective.
How would you describe the location around the circle? Maybe by "1 o'clock", etc.? Another way is to define the location of a "zero" point (it's arbitrary, but let's say it is where 3'oclock is) and then describe any point away from this in degrees, where 360 degrees are a full rotation around the circle.
As long as the movement continues clockwise, after one full rotation you might want to start counting the degrees over again at zero degrees. This is similar to the "phase wrapping" into the interval of -180 to 180 degrees on most plots. It's the same 360 degrees, just starting at the value of -180 instead of zero.
When I think of a sine wave propagating through space I like to envision the "helix" analogy I gave above. It is a way to explain phase and amplitude of a propagating wave.
Attachments
^Actually, there are no sound waves propagating in the air, but cyclic pressure variations! "Wave" is just graphical presentation of said recurring pressure variations
Dan Russell's Acoustics and Vibration Animations
What is a Wave?
Dan Russell's Acoustics and Vibration Animations
What is a Wave?
Last edited:
And what do you consider far field? Is it far enough to incorporate baffle effects (intended anomalies), or room effects (eg unintended anomalies)?
There has been mention of off-axis measurements. This is a way to answer all kinds of questions and produce a clear result. A crossover done this way is beyond the apparent scope of this thread,.. but specific questions could definitely be asked. Just having some off-axis measurements 'just for the sport of it' won't help.
Farfiled I took as 1m. My baffle is "infinite" as built in flush with wall. Gated to deal ? with room effects
This is not a zig zag. It is running downward continually, getting more steep at the right end of the graph. It keeps wrapping back upward to fit on the screen.
OK understand. How should it look if phase is good?
+1 on that.
What you see as a "zig zag" is just the requirement to represent the total phase lag within the boundaries of -180deg to +180deg. When the phase "falls" (lags) below -180deg, 360 degrees are added on and the line appears again at the top of the plot. In reality the phase is continually decreasing, or "running downhill".
It's convention to only plot phase within these boundaries. You can also think of the phase angle in this way:
Think of a circle.
Now envision that you are looking at the end of a perfectly straight pipe or tube end-on. In this perspective it looks like a circle.
Envision that, with time, a dot is moving into the pipe, away from the end. Instead of traveling straight down the middle of the pipe, it is moving in a helical path along the wall of the pipe, like this:
The position in time of such a movement, as viewed from the end of the pipe where the pipe looks like a circle, is a point moving around the circle. You cannot see the "distance away" because of your perspective.
How would you describe the location around the circle? Maybe by "1 o'clock", etc.? Another way is to define the location of a "zero" point (it's arbitrary, but let's say it is where 3'oclock is) and then describe any point away from this in degrees, where 360 degrees are a full rotation around the circle.
As long as the movement continues clockwise, after one full rotation you might want to start counting the degrees over again at zero degrees. This is similar to the "phase wrapping" into the interval of -180 to 180 degrees on most plots. It's the same 360 degrees, just starting at the value of -180 instead of zero.
When I think of a sine wave propagating through space I like to envision the "helix" analogy I gave above. It is a way to explain phase and amplitude of a propagating wave.
PHASE
I presume that the phase is adulterated because of the mass of speaker cone and coil etc which has to be accelerated. And ARTA compares the signal supplied to the speaker to the signal picked up by the measuring microphone? to produce its graph?
Then there is also the effect Filters have on the signal.
Can both phase shifts be corrected, or only the one caused by filters?
In the Hypex Filter Designer: in FAQs
Q: What about the phase of the filters?
A: The biquad filters are all minimum phase, which means that phase is directly linked to magnitude response in exactly the same way as an analogue filter. Since individual speaker drivers are minimum phase too, EQ'ing them flat also equalises the phase response.
MORE
Also in Hypex Filter Designer:
"4th Order Linkwitz Riley, which will result in 360 degrees phase shift. That way, the low and high output appear in phase (although the low output will have a one-period delay)"
So do you delay the high output? 360 degrees = how many secs?
Also says:
"The main advantage of LR filters is, when usind them as low-pass and high-pass crossover filters (with the same cut-off frequency) your total filter response will be flat."
- Status
- This old topic is closed. If you want to reopen this topic, contact a moderator using the "Report Post" button.
- Home
- Loudspeakers
- Multi-Way
- Freq measurements and Hypex Filter Design adjustments