George,
Here you are complete with reddish lingerie text to cheer up the images.
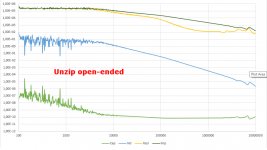
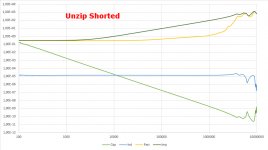
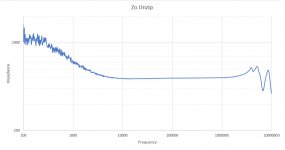
Images are for the unzipped cable, 5 meters long.
This looks infinitely better without the funny bulge in the middle and is based on 750 samples, where the measuring probe was removed from the equation through a calibration file.
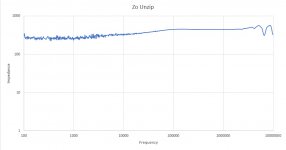
the 300R that you found to optimally terminate the cable seems to correspond well with these results.
Hans
.
P.S. That the impedance open-ended stops at ca 10Khz and below, has of course to do with the impedance of the measuring equipment.
The Impedance line should have followed the way up intil 100Hz, ans so should the inductance line have done,
The capacity in that case would have been flat all the way starting at 100Hz.
When manipulating this by hand, Zo goes to 844R at 100Hz, slowly descending to 450R at 10Khz, so measuring thr LF part of two separated wires is a bit tricky.
Here you are complete with reddish lingerie text to cheer up the images.
Images are for the unzipped cable, 5 meters long.
This looks infinitely better without the funny bulge in the middle and is based on 750 samples, where the measuring probe was removed from the equation through a calibration file.
the 300R that you found to optimally terminate the cable seems to correspond well with these results.
Hans
.
P.S. That the impedance open-ended stops at ca 10Khz and below, has of course to do with the impedance of the measuring equipment.
The Impedance line should have followed the way up intil 100Hz, ans so should the inductance line have done,
The capacity in that case would have been flat all the way starting at 100Hz.
When manipulating this by hand, Zo goes to 844R at 100Hz, slowly descending to 450R at 10Khz, so measuring thr LF part of two separated wires is a bit tricky.
Attachments
Last edited:
Thank you Hans.
They are much better than the previous.
Now can you please show the third one again, this time having the Y axis go from 100 to 500 Ohm?
And may I ask
How you meazure Imp ?
How you calculate Zo?
George
They are much better than the previous.
Now can you please show the third one again, this time having the Y axis go from 100 to 500 Ohm?
And may I ask
How you meazure Imp ?
How you calculate Zo?
George
George,
To start with, I produce a Bode diagram with my Picoscope 5000 series with FRA4PS, supported by Picotech.
I think I already explained that before. FRA4PS is robust and produced a .csv file with frequency, gain and phase.
This is the base for further processing.
But first of all, I produce a .csv file with noting connected, except the probe.
From this data, I produce a correction file by simply inverting all gain in dB and phase data.
Next step is to measure the DUT, in this case the cable.
To the gain and phase from the cable measurement I add the probe correction file, so eliminating the contribution of the probe.
Then I can compute impedance, Resr, Induction and capacitance.
I have two ways of computing in Excel that are completely different, one is simply doing the complex math, the other one is a more complicated way constructed by Tektronix following a completely different road.
It won't surprise you, but both algorithms produce exactly the same outcome, but it was nice to have this "second opinion" at hand as a confirmation.
I even constructed a DUT with a 10mH coil// 1nF cap and a 100R resistor in series, simulated the thing in LTSpice and compared it to the real measurement resulting in a 100% overlap.
So my Excel model is well tested and produced the images that I have shown.
One of the four things calculated, is the impedance, that's one of your questions.
When having the impedances Zopen and Zshort, the last step is to let Excel compute Zo=sqrt(Zopen*Zshort).
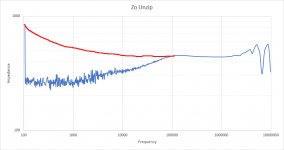
Your last question is a plot with Zo from 100R to 500R.
Since I have explained that because the equipment reaches its borders in resolution at LF, Zo should in fact be 844R at 100Hz, simply found by setting the gain at exactly 1 instead of 0,999749, that close !
That's why I have plotted from 100R to 1000R, where from 100Hz upwards I have drawn a red line how it should have been.
As a matter of fact, thinking loud, my reference resistor was 100R.
Had I taken a much larger resistor, resolution at LF would have been much better, so that's what I will do, way better in case of this unzipped cable.
I'll be back.
Hans
To start with, I produce a Bode diagram with my Picoscope 5000 series with FRA4PS, supported by Picotech.
I think I already explained that before. FRA4PS is robust and produced a .csv file with frequency, gain and phase.
This is the base for further processing.
But first of all, I produce a .csv file with noting connected, except the probe.
From this data, I produce a correction file by simply inverting all gain in dB and phase data.
Next step is to measure the DUT, in this case the cable.
To the gain and phase from the cable measurement I add the probe correction file, so eliminating the contribution of the probe.
Then I can compute impedance, Resr, Induction and capacitance.
I have two ways of computing in Excel that are completely different, one is simply doing the complex math, the other one is a more complicated way constructed by Tektronix following a completely different road.
It won't surprise you, but both algorithms produce exactly the same outcome, but it was nice to have this "second opinion" at hand as a confirmation.
I even constructed a DUT with a 10mH coil// 1nF cap and a 100R resistor in series, simulated the thing in LTSpice and compared it to the real measurement resulting in a 100% overlap.
So my Excel model is well tested and produced the images that I have shown.
One of the four things calculated, is the impedance, that's one of your questions.
When having the impedances Zopen and Zshort, the last step is to let Excel compute Zo=sqrt(Zopen*Zshort).
Your last question is a plot with Zo from 100R to 500R.
Since I have explained that because the equipment reaches its borders in resolution at LF, Zo should in fact be 844R at 100Hz, simply found by setting the gain at exactly 1 instead of 0,999749, that close !
That's why I have plotted from 100R to 1000R, where from 100Hz upwards I have drawn a red line how it should have been.
As a matter of fact, thinking loud, my reference resistor was 100R.
Had I taken a much larger resistor, resolution at LF would have been much better, so that's what I will do, way better in case of this unzipped cable.
I'll be back.
Hans
Attachments
Thank you Hans for the detailed explanation.
My question had to do with what data you probe and how.
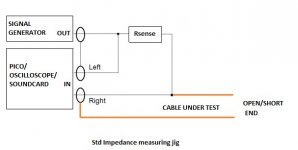
So you are using a std impedance jig. You use the data (corresponding to Vz, Iz, theta) of cable open/cable short tests to do the calculations.
Tektronix, I'm aware of this from them:
https://download.tek.com/document/4...nerator to measure capacitor 4-24-2013 DP.pdf
George
My question had to do with what data you probe and how.
So you are using a std impedance jig. You use the data (corresponding to Vz, Iz, theta) of cable open/cable short tests to do the calculations.
Tektronix, I'm aware of this from them:
https://download.tek.com/document/4...nerator to measure capacitor 4-24-2013 DP.pdf
George
Attachments
Hans I suggest you check the Vout of your generator. It may droop.As a matter of fact, thinking loud, my reference resistor was 100R.
Had I taken a much larger resistor, resolution at LF would have been much better, so that's what I will do, way better in case of this unzipped cable.
I'll be back.
Hans
Vdrop at Rsense, and Vdrop at Z leave one of the V1, V2 at very low level depending on Z.
Increasing Rsense will increase Vdrop there, making things worse.
Check voltages in operation. Can your generator drive those impendances at all frequencies?
I use a power amplifier to drive the jig (low Rout matters as well)
I use calibrated resistors to check validity of data across the full span of anticipated impedances.
If generator can drive the jig , the jig gives reliable results across 1/10x and 10x of Rsense value and a bit beyond that
George
George,
Thanks for your suggestions.
The Tektronix link that you gave, shows their somewhat complex way of calculating and that is my second way of calculating.
FRA4PS already normalizes the two signals at both sides of Rsense, say V1 and V, by dividing both by V1.
That makes V1=1 and V2=V, already simplifying things: What FRA4PS then supplies are just: Freq, V, Phase
Z=Rref*V/(1-V)
Taking V=A+jB, where A=V*cos(phase) and B=V*sin(phase), its a much easier calculation IMO to find resp. Z, Resr, Ind and Cap.
But as said, both ways lead of course to the same result.
But now the voltage droop of the generator that you mention.
Because V1 has been normalised, voltage droop plays no role, as long as it is still measurable with the 16bit A/D.
I'm using 4Volt-pp, the maximum my 50R generator can supply for this specific measurement and goes up to 30Mhz. No power amp can do the same up to this frequency.
And with a shorted cable, where the generator is maximally loaded, there seems to be no problem at all with the 100R Rsense.
The problem at LF with this Rsense at 100R is not the droop, but the fact that the load with open-ended cable is several Mohm, running in a resolution problem with the A/D conversion.
That's what will be improved when using a higher value for Rsense.
At the other end of the spectrum, there are some irregularities most likely caused by the ground lugs of the probe, acting as inductors.
That's why I will change the setup in a better HF configuration where the probes are plugged into sockets.
So work in progress 😀 😀
Hans
That's why I will change the setup in a better HF configuration where the probes are plugged into sockets.
So work in progress 😀 😀
Thanks Hans
You enter dangerous territories (JN worries) 😉
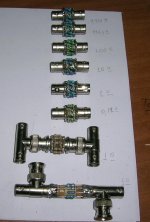
I’ve built a low parasitics jig implementing JN schematic many years ago, time to test it.

George
Attachments

Recall from that app note that where you measure the current is important. The CVR at the source will show differently than the CVR at the load. To monitor the load, the cvr has to be at the load. The only difference will be the settling time at the load, which will be load impedance vs line impedance dependence.
Differential measurements are the only way to do it as well. As the cable charges up current wise, any loop formed will toss error into a single ended measure.
jn
Differential measurements are the only way to do it as well. As the cable charges up current wise, any loop formed will toss error into a single ended measure.
jn

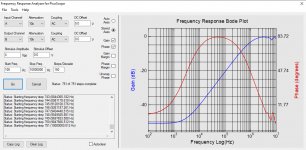
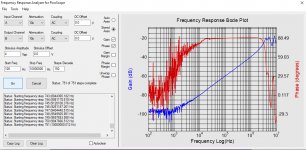
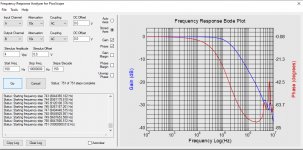
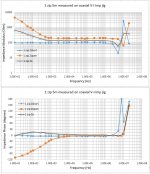
Here are the Bode plots with resp 100R and 10K with a shorted unzipped line.
Obvious is that 100R is no problem at all regarding droop but that 10K exceeds the borders of the resolution.
On the other hand, the third image is for the open-ended line with 10K, that's looking good.
Hans
.
Obvious is that 100R is no problem at all regarding droop but that 10K exceeds the borders of the resolution.
On the other hand, the third image is for the open-ended line with 10K, that's looking good.
Hans
.
Attachments
Two R sense then?
The 100 Ohm for shorted lines and the 10k for the open (and two calibrations).
George
The 100 Ohm for shorted lines and the 10k for the open (and two calibrations).
George
Yes, different Rsense resistors for shorted and open.
It became a trade-off between LF and HF.
This unzipped cable is very hard to conquer.
At 10K with open ended cable, LF is perfect, bit HF above 1Mhz becomes troubled. But maybe my 10K Rser was not the perfect resistor for the job.
That's why I went to 1K as a compromise, giving some noise LF, but still good enough to get the message and a far cry from the previous results with FRA Imp Viewer.
For the shorted unzipped cable I used a low inductance 100R resistor, but I got the impression that lower could have been even better, but I called it a day.
Maybe the ripple above 1Mhz would have been reduced with a lower value.
I'll try that tomorrow and yet another option that I still have is to replace the probes by coax cables.
And yes, for all options I have to make each time separate calibration files.
Hans
.
Attachments
I suspect the unzipped is broadcasting, or at the least communicating with other things....perhaps lifters?😉
jn
jn

I must say, I am in awe of what you two are doing. Thank you for the effort.
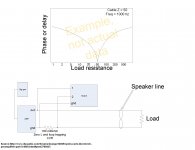
Phase vs frequency vs line to load ratio...
To wit...with a 150 ohm line, how does the midband phase (temporal shift) measure when the load shifts from 8 ohms to 30.
jn
Phase vs frequency vs line to load ratio...
To wit...with a 150 ohm line, how does the midband phase (temporal shift) measure when the load shifts from 8 ohms to 30.
jn
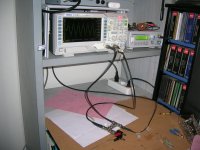
The first manual, spot-freq test run of the coaxial V-I imp jig run smoothly with good results (10 Ohm CVR)
A 50 Ohm signal generator drives the jig at 2-4 Vpp
George
Well done as always, but I have no idea what you are doing.
In your drawing in #187, you measure a voltage with channel 2.
How do you convert this into a current and why do you convert the voltage into a current in the first place ?
With a shortened cable, a CVR of 10R and phase=0, I would expect at 10Hz 1.31Volt/10R=131mA, but you specify 13.1mV ??
At the same time with an open cable I would expect at 10Hz no current flowing at all, but you measure 0.23mA with a phase of -110 degrees.
How's that possible, more than -90 degrees and so much current, implying a capacity of 4,5mF ??
Hans
George,
Maybe a bit of an open door, but you cannot simply divide a voltage by a current that’s -110 degrees shifted to get the impedance.
When doing this the correct way, you would get 6R instead of 4k4.
Hans
Maybe a bit of an open door, but you cannot simply divide a voltage by a current that’s -110 degrees shifted to get the impedance.
When doing this the correct way, you would get 6R instead of 4k4.
Hans
Hi HansWell done as always, but I have no idea what you are doing.
In your drawing in #187, you measure a voltage with channel 2.
How do you convert this into a current and why do you convert the voltage into a current in the first place ?
Sorry for the confusion. Forget my specific jig, go back to post 187 1st attachment
There is John’s schematic of the jig. Let’s use this.
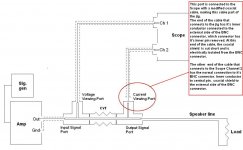
Ch1 measures the Voltage across the DUT and Ch 2 measures the Voltage drop across a resistor which is in series with the return line from the DUT. If we divide this voltage drop by the value of the resistor we get the current through the load. That’s why this resistor is named CVR (current viewing resistor). This resistor has to be of low inductance.
This method is basic, pure and simple. Voltage pick-up at Ch1, current pick-up at Ch2 (I=Vch2/VCR), then V/I= Z modulus. No advanced equipment required, no difficult maths.
The time delay btn Ch1 and Ch2 (voltage and current) has to be translated into phase in relation to test freq. This could be done mathematically, or reading the ellipse method on the scope screen. As all digital scopes today can provide readout of phase difference, all three measurements can be available immediatelly. Then Zo=SQRT(Zshort*Zopen), ditto for the phase Φo=SQRT( Φshort* Φopen).
Not many test points need to be logged, changes are gradual, except at the MHz range where the sharp resonances take place. Doing a preliminary search in scope X-Y mode while sweeping frequency reveals these areas in short time. If of interest, manual detailed spot testing can extract data of the problematic area.
Watching the test waveforms on the scope screen helps preventing wrong level settings. High level may load generator too much, waveforms distort. Low level may lower SNR too much, noisy waveforms. Adjusting generator level during test for to keep optimum waveform doesn’t invalidate measurements as the ratio of Ch1/ Ch2 readings doesn’t change.
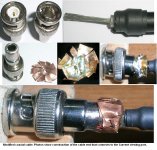
Now, go back to 2nd attachment of post 187. The constructional detail that makes Ch2 to read the voltage across CVR is enclosed in the red circle
The impedance run I showed it’s the first with this jig (Ch2 data shown is already divided by 10, the value of the CVR used), no compensation so far. I am checking now the behavior of the jig alone to see how it goes.
If you still have any objection or you spot anything wrong, please I am all ears. It’s the first time I am implementing the short-open Zo estimation, anything goes for me.
George
George,
I understood very well what you did, not a single confusion about that.
But:
1) why do you convert channel 2 into a current, that's just an additional step with potential prone to calc. errors and it does not add any additional vital information.
If keeping the voltages as they are, you can place your two voltage measurements directly into the Tektronix formula.
2) Dividing a voltage by a phase shifted current gives a wrong result, example:
At 10Hz open ended 1,023V/0,23mA and -110 degrees phase shift doesn't give 4478R but 6R.
This apart from the fact that -110 degrees phase shift is hardly possible.
3) I think you are using a 100R VCR instead of 10R, example:
Shorted cable at 10Hz, phase 0 degrees, 1.31Vin should give 131mA with 10R and not 13.1mA.
Hans
George,
I've put your figures in the Tektronix model, where I have recalculated Ch2:Vin=Ch1:Vin-Ch2:Iin*10R.
Result is quite odd as can be seen. Hope I did nothing wrong.
I have attached the whole Excel file disguised as text for you to check,
calculating everything for the shorted and the open cable and the resulting Zo.
Hans
.
Attachments

- Home
- General Interest
- Everything Else
- Zip cord for speaker test