
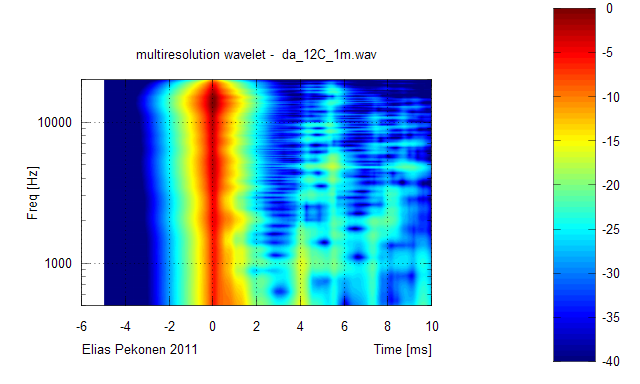


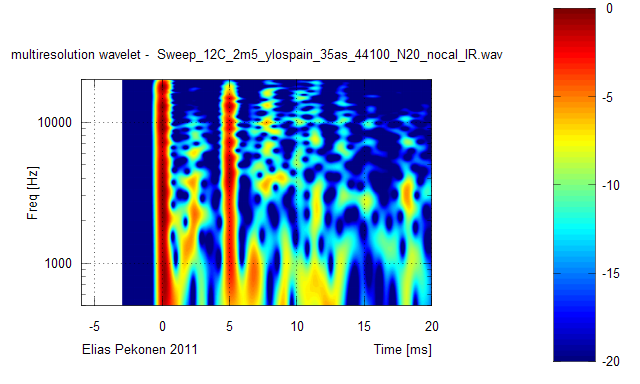


Ok. As can be seen the most notable differences are:
1) More sharply focused locations for amplitude maximas
2) Individual reflections/diffractions have increased temporal resolution and are more clearly visible as vertical lines
3) In the frequency domain the comb filtering is more consistent and organized as horisontal lines
Next project:
Investigate implementing this new multiresolution into constant Q wavelets! May I run into a dilemma: How a constant can be multi? 🙄
By the way, multiresolution with Bark could be a killer wavelet! Maybe a sunami....
- Elias
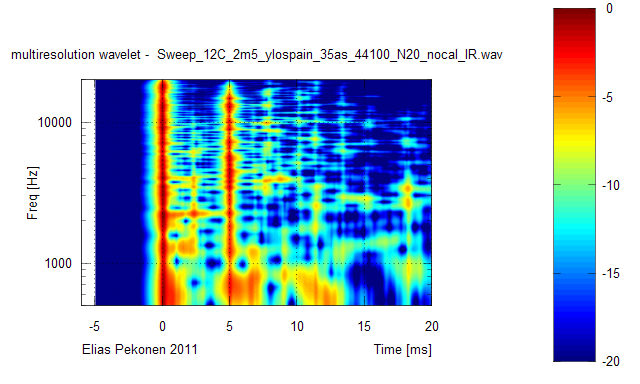
Hello,
I have bad news and good news 😀
- Elias

Bad news first:
As everyone probably noticed my multiresolution wavelet has been severely lacking! It has been only monodimensional in the resolution space! 😱 🙁 😱 😛
I wonder why nobody informed me about this obvious lack 😕
Then the good news:
I made the required additions to the resolution domain and generated new 'true' multidimensional wavelets 😎
- Elias
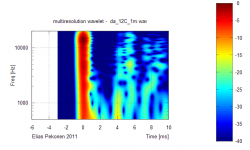
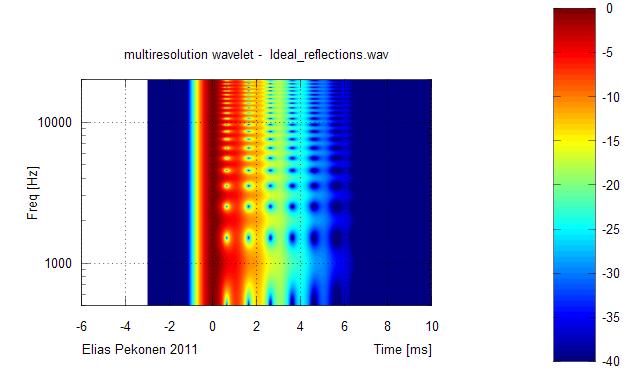
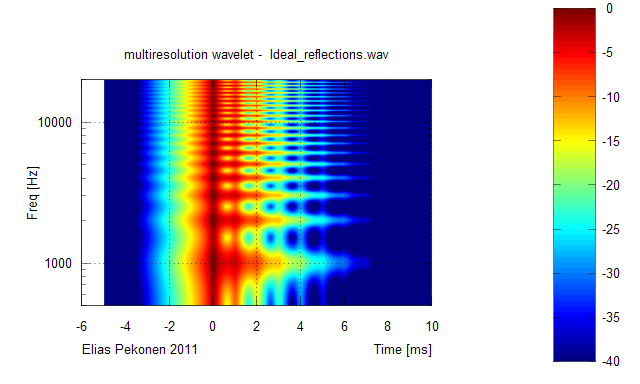
Here is before-after for my ideal reflections impulse response:
- Elias
Well, I'm thinking about this difficulty quite some time now - but - I'm not sure if this can be solved by wavelet analysis at all - or more precisely - by any time / frequency analysis / spectrogram.
The problem that arises IMO is that - as most clearly seen with the new plot - one very important aspect does not come out clearly enough.
This is the basic fact that comb filter effects can happen *not any earlier* than when the second impulse happens.
This means that for the time slot between 0 and 1ms (in above case) there should be no comb filtering plotted.
Obviously this is possibly not achievable no matter how far we stretch display options.
🙁
By the way, multiresolution with Bark could be a killer wavelet! Maybe a sunami....
- Elias
I'm looking forward to what you may come up with..
🙂
Michael
Last edited:
Hi,
There is no problem! 😀
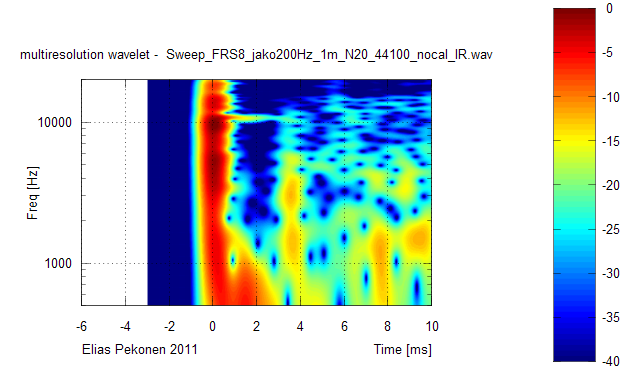
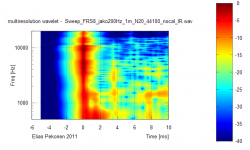
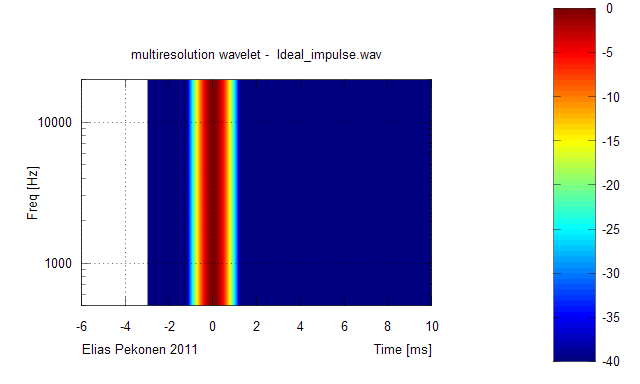
With the constant Q step one has what is required for your case. Here for ideal reflections. (Time scale a bit too long but can see that for the first 1ms no combing, first reflection arrives at 1ms)

For a real life measurement here. (Time axis vertical this time, and freq only up to 2kHz). See, before 3ms (time of first reflection) no comb filtering. Between 3ms and 7ms comb filtering pattern is constant. At 7ms is second major reflection and comb pattern changes completely. Here interesting things happen: a peak is split to two, and a notch is changed to peak, etc.

One question though, when this step signal should stop, as now it remains forever? 🙂
- Elias
There is no problem! 😀
With the constant Q step one has what is required for your case. Here for ideal reflections. (Time scale a bit too long but can see that for the first 1ms no combing, first reflection arrives at 1ms)
For a real life measurement here. (Time axis vertical this time, and freq only up to 2kHz). See, before 3ms (time of first reflection) no comb filtering. Between 3ms and 7ms comb filtering pattern is constant. At 7ms is second major reflection and comb pattern changes completely. Here interesting things happen: a peak is split to two, and a notch is changed to peak, etc.
One question though, when this step signal should stop, as now it remains forever? 🙂
- Elias
Well, I'm thinking about this difficulty quite some time now - but - I'm not sure if this can be solved by wavelet analysis at all - or more precisely - by any time / frequency analysis / spectrogram.
The problem that arises IMO is that - as most clearly seen with the new plot - one very important aspect does not come out clearly enough.
This is the basic fact that comb filter effects can happen *not any earlier* than when the second impulse happens.
This means that for the time slot between 0 and 1ms (in above case) there should be no comb filtering plotted.
Obviously this is possibly not achievable no matter how far we stretch display options.
🙁
Michael
Hi,
There is no problem! 😀
With the constant Q step one has what is required for your case. 🙂
- Elias
Any chance you make this one available too - or did I miss it ?
Michael
Yes I'm planning to do so. And no you didn't miss it yet because it's on progress. It will arrive here:
http://dl.dropbox.com/u/2400456/html/Elias Pekonen/main.html
go to wavelets.
See, I have chapter link for constant Q step waiting lol 😀 But first I'm going to crunch this multiresolution thing..
- Elias
http://dl.dropbox.com/u/2400456/html/Elias Pekonen/main.html
go to wavelets.
See, I have chapter link for constant Q step waiting lol 😀 But first I'm going to crunch this multiresolution thing..
- Elias
Any chance you make this one available too - or did I miss it ?
Michael
As everyone probably noticed my multiresolution wavelet has been severely lacking! It has been only monodimensional in the resolution space! 😱 🙁 😱 😛
I wonder why nobody informed me about this obvious lack 😕
I wonder how you can wonder !😀
If the average user of the WTF! is as noobish as I am in this domain, then he will be already very happy to see something appearing in the screen. Impossible then to send wise comments.
If you absolutely want some customer feedback
 :
:when using a 16 or 32 bits .wav file recorded from REW 5, how comes the first plot of the original impulse is desperately flat ? BTW, after it works, but maybe not very accurate ?
Both of you are making a great job here, Thx.

Yes I'm planning to do so. And no you didn't miss it yet because it's on progress. It will arrive here:
http://dl.dropbox.com/u/2400456/html/Elias Pekonen/main.html
go to wavelets.
See, I have chapter link for constant Q step waiting lol 😀 But first I'm going to crunch this multiresolution thing..
- Elias
Ahh, yesss - I see !
😱
And the veil was lifted and the wavelet paradise appeared before our eyes…
you write great poems too - lovin' your style !
😀
Michael
If you absolutely want some customer feedback
when using a 16 or 32 bits .wav file recorded from REW 5, how comes the first plot of the original impulse is desperately flat ? BTW, after it works, but maybe not very accurate ?
Both of you are making a great job here, Thx.
The first plot appearing at WTF Package is displaying the first 100ms of the impulse response file - no matter if there is something happening there or not.
If you have a lot of delay in your measurement setup - possibly caused by some buffer settings - it might happen you don't see anything within that first 100 ms.
The second plot is normalized to the peak - so whenever / wherever the peak happens in the original impulse response file, it *should* appear at time zero in the second plot.
Also the second plot is already zoomed in the time scale to what your analysis settings are (a few single /double digit ms usually).
Michael
Elias,
honestly speaking I have problems to interprete the pictures of your message #360 (based on the ideal reflections pulse impulse response):
the (attenuated) reflections are following the main pulse in a distance of 1 ms. Thus IMO in reality at e.g. 10 kHz the single pulses do not interfere. There is no such combing effect as shown by the pictures.
I would expect something like this:
I guess that the constant Q wavelet gives also more realistic pictures ?
Best, Uli
PS: there are some artifacts at the top frequency range, don't worry about
honestly speaking I have problems to interprete the pictures of your message #360 (based on the ideal reflections pulse impulse response):
the (attenuated) reflections are following the main pulse in a distance of 1 ms. Thus IMO in reality at e.g. 10 kHz the single pulses do not interfere. There is no such combing effect as shown by the pictures.
I would expect something like this:
An externally hosted image should be here but it was not working when we last tested it.
I guess that the constant Q wavelet gives also more realistic pictures ?
Best, Uli
PS: there are some artifacts at the top frequency range, don't worry about
Thx for the clarifications
The new version works as a charm ! The CSD is a great improvement over Arta where it is always required to adapt all the parameters before having something exploitable, then removing the "objectivity" of the plot.
here it's ...
...
great job
The new version works as a charm ! The CSD is a great improvement over Arta where it is always required to adapt all the parameters before having something exploitable, then removing the "objectivity" of the plot.
here it's
...great job
Hello Uli,
See post #359 that specific plot for only one impulse. While yours is constant Q, I took some liberties to adapt the wavelet for a specific purpose: to improve resolution of a CSD (posts #360-363).
For a constant Q type of wavelet multiresolution would look like this:
Really the comb filtering effect, or the overlap, depends on the chosen length of the wavelet. In a resolution vise it depends which space you choose from the resolution domain.
- Elias
See post #359 that specific plot for only one impulse. While yours is constant Q, I took some liberties to adapt the wavelet for a specific purpose: to improve resolution of a CSD (posts #360-363).
For a constant Q type of wavelet multiresolution would look like this:
An externally hosted image should be here but it was not working when we last tested it.
Really the comb filtering effect, or the overlap, depends on the chosen length of the wavelet. In a resolution vise it depends which space you choose from the resolution domain.
- Elias
Elias,
honestly speaking I have problems to interprete the pictures of your message #360 (based on the ideal reflections pulse impulse response):
the (attenuated) reflections are following the main pulse in a distance of 1 ms. Thus IMO in reality at e.g. 10 kHz the single pulses do not interfere. There is no such combing effect as shown by the pictures.
I would expect something like this:
An externally hosted image should be here but it was not working when we last tested it.
I guess that the constant Q wavelet gives also more realistic pictures ?
Best, Uli
PS: there are some artifacts at the top frequency range, don't worry about
Last edited:
Hello Radugazon,
I'm happy to hear we have a satisfied customer 🙂
Indeed, Diyaudio wavelet software package has rapidly gained worldwide user community!
YES! This was one of the principal reasons for me to start the wavelet journey. Easy to generate, no user errors, comparable with others. Then came the "CSD wavelet" like this:
Maybe better to rename this type of plot to wavelet CSD or something.
- Elias
I'm happy to hear we have a satisfied customer 🙂
Indeed, Diyaudio wavelet software package has rapidly gained worldwide user community!
TThe CSD is a great improvement over Arta where it is always required to adapt all the parameters before having something exploitable, then removing the "objectivity" of the plot.
YES! This was one of the principal reasons for me to start the wavelet journey. Easy to generate, no user errors, comparable with others. Then came the "CSD wavelet" like this:
Maybe better to rename this type of plot to wavelet CSD or something.
- Elias
Hello Uli,
See post #359 that specific plot for only one impulse. While yours is constant Q, I took some liberties to adapt the wavelet for a specific purpose: to improve resolution of a CSD (posts #360-363).
Really the comb filtering effect, or the overlap, depends on the chosen length of the wavelet. In a resolution vise it depends which space you choose from the resolution domain.
- Elias
Elias,
I appreciate your efforts, no doubt about.
But I'm just a bit conservative. As in my feeling the top view of #360 can lead to wrong interpretations, a "multiresolution" CSD of a real world signal may be even more misleading.
We have to be aware about the limits.
Best regards, Uli
Hi,
" the top view of #360 can lead to wrong interpretations", which in my opinion can be translated that a CSD (in general) can lead to wrong conclusions, because most (= all) of the available audio softwares have too many parameters for the user to set up a CSD plot! With parameters that change the plot dramatically, user gets confused and wrong interprations can follow.
This is what I try to change in my wavelet CSD, no user entered parameters!
And, I think multiresolution wavelet CSD is even better, because it gives all the available resolutions (in a practical range) one can have in a one plot. Again no parameters needed from the user. Bliss!
- Elias
Elias,
I appreciate your efforts, no doubt about.
But I'm just a bit conservative. As in my feeling the top view of #360 can lead to wrong interpretations, a "multiresolution" CSD of a real world signal may be even more misleading.
We have to be aware about the limits.
Best regards, Uli
Elias,
honestly speaking I have problems to interprete the pictures of your message #360 (based on the ideal reflections pulse impulse response):
the (attenuated) reflections are following the main pulse in a distance of 1 ms. Thus IMO in reality at e.g. 10 kHz the single pulses do not interfere. There is no such combing effect as shown by the pictures.
I would expect something like this:
An externally hosted image should be here but it was not working when we last tested it.
I guess that the constant Q wavelet gives also more realistic pictures ?
Best, Uli
PS: there are some artifacts at the top frequency range, don't worry about
Hello Uli
nice to see you adding some additional work !
Is it already available to play with ?
Michael
...
Maybe better to rename this type of plot to wavelet CSD or something.
...
http://www.diyaudio.com/forums/soft...wavelet-analysis-available-2.html#post2495381

Hi,
There is no problem! 😀
With the constant Q step one has what is required for your case.
...
One question though, when this step signal should stop, as now it remains forever? 🙂
- Elias
Why not assign a variable - say defaulted to 10ms to get started?
Michael
- Status
- Not open for further replies.
- Home
- Loudspeakers
- Multi-Way
- WTF!? Wavelet TransForm for audio measurements - What-is? and How-to?