Is there a particular trend we are looking for in the out of phase curve? Isn't it the room signature plus off axis performance of the speaker?
It is the reverberent field spectrum. So it is a combination of room reverberence, listening distance and overall speaker directivity. Put another way it is the speaker power response as modified by the absorption vs. frequency characteristics of the room.
I would think a smooth downhill trend, or flat through the mids then sloping down would be a good result.
The real question is how low below the direct sound. This gets straight to what you desire: 10 or more dB down would be a high clarity, direct sound dominant sound. Something like a Bose 901 (negative effective d.i.) would give a reverberent field level higher than the direct field and a room involved sound.
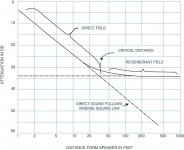
Attached is a figure that shows how level drops as we move away from a sound source. At the early distances the direct field dominates and the level drops as we move away from the source, falling 6dB for every doubling of distance. At a certain distance (called the critical distance) the direct field and the reverberent field are just equal. As you go farther away than that the reverberent level is approximately constant. The direct field is still falling but we don't see it in the total result because it is now well below the reverberent level.
Both speaker directivity and room "deadness" would push down the level of the reverberent field.
The relative level of the two is exactly what we are measuring.
David
p.s. Should be "distance from speaker". Gotta be careful who you steal these diagrams from!
Attachments
Last edited:
Actually come to think of it, this is not quite what we're measuring.Attached is a figure that shows how level drops as we move away from a sound source. At the early distances the direct field dominates and the level drops as we move away from the source, falling 6dB for every doubling of distance. At a certain distance (called the critical distance) the direct field and the reverberent field are just equal. As you go farther away than that the reverberent level is approximately constant. The direct field is still falling but we don't see it in the total result because it is now well below the reverberent level.
Both speaker directivity and room "deadness" would push down the level of the reverberent field.
The relative level of the two is exactly what we are measuring.
In the out of phase connection we're exactly cancelling the direct field from the two speakers (assuming the speakers are well matched in level and frequency response) leaving only the reverberant field. This corresponds with the dotted horizontal line on the graph.
However in the in-phase connection we're not measuring the direct field (represented by the downwards sloping line) because we're not windowing out the reflections. (Practically speaking we couldn't at the listening position anyway, except perhaps above 3Khz or so)
What we're actually measuring is the sum of the direct field and the reverberant field, as represented by the curved line on the graph.
So we're comparing direct + reverberant vs reverberant only. As a consequence of this we can't measure situations where the direct field is significantly below the reverberant field because its impossible for direct + reverberant to be below reverberant only. With a negative DI speaker the in-phase and out of phase connections will just measure roughly equal but with no way of knowing how far below the direct field is.
Also the critical distance where direct and reflected are equal will be represented not by equal amplitude in the two measurements but by the direct+reverberant field being 3dB greater than the rereverberant field only. (Non-coherent addition)
For ratios of over 10dB or so direct+reverberant/reverberant will start to approximate direct/reverberant.
What this all means is that my 4-6dB ratio is only just slightly above the 3dB that represents the critical distance 🙁
Last edited:
Actually come to think of it, this is not quite what we're measuring.
In the out of phase connection we're exactly cancelling the direct field from the two speakers (assuming the speakers are well matched in level and frequency response) leaving only the reverberant field. This corresponds with the dotted horizontal line on the graph.
However in the in-phase connection we're not measuring the direct field (represented by the downwards sloping line) because we're not windowing out the reflections. (Practically speaking we couldn't at the listening position anyway, except perhaps above 3Khz or so)
Good catch, I was just beginning to think about this. I think it is similar to talking about "signal to noise ratio" when we really mean "signal plus noise, to noise" ratio. As long as the in-phase case gives a couple of dB higher than the cancelled case we can calculate the direct only level to some accuracy. You should be able to unlog them and subtract the noise from the signal plus noise to get the signal only level. Assume that direct and reverberant are orthogonal vectors which, on average, they will be.
For those that have much more reverberent level than direct, you could always halve the distance and measure again, then assume that the direct level at the normal position was 6dB less.
In the end the primary objective is to see where we sit relative to the critical distance, and to compare that to our perception of imaging precision or spaciousness.
Also the critical distance where direct and reflected are equal will be represented not by equal amplitude in the two measurements but by the direct+reverberant field being 3dB greater than the rereverberant field only. (Non-coherent addition)
Agreed.
David S.
What the procedure for doing this? As below?
- Put speakers in reverse phase (flip polarity 1 channel)
- Play mono pick noise with mic at listening position
- Find speaker position, toe in and balance for best cancellation
- Record out of phase signal
- Correct speaker polarity and record again for in phase
Rather than moving your speakers around, just slide your microphone laterally for best cancellation at high frequencies, even if its not your exact listening position.
- Find speaker position, toe in and balance for best cancellation
If you have a real time analyser that you can watch as you move the mic it's pretty easy to find the exact spot. (You could verify it with an impulse response - with both speakers active the timing has to be dead on to get a single impulse in phase or a cancelled impulse out of phase)
Have the microphone at a normal listening distance, and its probably best for it to be at the right height to be on the design axis of the speaker so you're not too far into any vertical polar response notches...
That's about it. I find 1/3rd octave averaging makes the results a lot easier to interpret, otherwise the extreme narrow band variations obscure the overall trends.
Edit: As Dave suggested, also try adjusting the balance control to make sure you're getting maximum cancellation when out of phase in case there is a balance error in the speakers/amplifier. Or at least compare Left and Right only measurements to see that they're well matched at high frequencies as I did in my first image.
Last edited:
What does the impulse response look like for the out of phase measurement? I was getting nothing in particular, just random ripples.
Well the objective is just to cancel the direct sound as perfectly as possible in the out of phase connection. If you find that this position is significantly to one side of your listening position you might consider moving your seat or speakers at a later date 😉OK. I was going to move the mic but thought that might be cheating! 😀
That's pretty much what you'd expect to see. If you do a good job of cancelling both speakers in the out of phase mode there won't be an obvious impulse at the beginning that stands out above everything else - just a lot of small impulses from all the room reflections, at roughly the same amplitude, which will look a bit like noise.What does the impulse response look like for the out of phase measurement? I was getting nothing in particular, just random ripples.
Last edited:
What does the impulse response look like for the out of phase measurement? I was getting nothing in particular, just random ripples.
That would be pretty interesting to look at also. Ideally the reflections and reverberent tale would be the same in both phases (some reflections would likely flip polarity), but the direct response would totally cancel for out-of-phase.
This also suggests how someone could determine the direct to reflected ratio, even if the direct level is relatively low. Gate the front for the direct sound. Gate the later for the reverberent curve.
Regards,
David
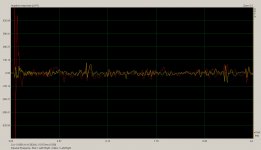
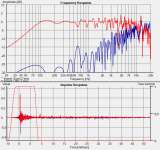
I was having a look at it earlier and thinking of posting it. See attached image. Red is in phase and yellow is out of phase, both in the same scale and from the same measurements as before.That would be pretty interesting to look at also. Ideally the reflections and reverberent tale would be the same in both phases (some reflections would likely flip polarity), but the direct response would totally cancel for out-of-phase.
The initial impulse is imperfectly cancelled, although to be honest I didn't try adjusting the channel balance for optimum cancellation during the original test. It's still smaller than the early reflections though.
Time zero is about 3ms on the scale. (ARTA always normalizes the initial impulse rise to sample number 300 in single channel mode)
In the out of phase scenario I reversed the left channel, so we can see that the early wall reflection from the right speaker at ~5ms (actually ~2ms) stays in the same phase, while the contra-lateral reflection from the left channel around 10ms is reversed.
The bump around 4.5ms is (actually 1.5ms from time zero) is probably the floor reflection - so when the phase is reversed the floor reflections also cancel each other. The bump just past 7.7ms may also be the ceiling reflection which will also cancel each other when in reverse phase.
Wouldn't that only determine the direct to reflected ratio at high frequencies though due to the small gate time ?This also suggests how someone could determine the direct to reflected ratio, even if the direct level is relatively low. Gate the front for the direct sound. Gate the later for the reverberent curve.
I've used the second part of that trick before - gate out as much of the direct impulse as you can by setting the start marker just before the first early reflection and no end marker and you more or less get the room response without the direct signal.
The problem is always in obtaining the direct signal (down to a low frequency) without interference from the reflections...
Attachments
Last edited:
If you find that this position is significantly to one side of your listening position you might consider moving your seat or speakers at a later date 😉
Done! Had to move right 7". Fixed now. Impulse and SPL matched very closely between the 2 speakers. Below is my attempt at the in phase/out of phase trick. Looks like between 10-15dB cancellation is the best I can do.
Will study the others posted here to get a better idea of everyone else's results.
Attachments
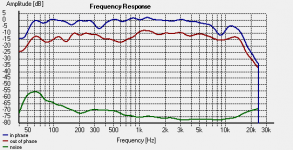
10-15dB is very good. 🙂
There's something a bit strange going on at 9Khz in your measurement though ?
There's something a bit strange going on at 9Khz in your measurement though ?
Done! Had to move right 7". Fixed now. Impulse and SPL matched very closely between the 2 speakers. Below is my attempt at the in phase/out of phase trick. Looks like between 10-15dB cancellation is the best I can do.
Will study the others posted here to get a better idea of everyone else's results.
Are you living in the countryside? The noise floor is unusually low. What does your room and speaker setup look like?
There is a narrow notch in the response (about 1/12th octave) at 8.4Khz on my Altec 1005 horn + 288 driver combo. I've been working with Jean-Michel to find the cause, so far no luck. 🙁 It looks wider here because of the 1/3 octave smoothing.
That noise floor is relative to the playback level circa 83dB. I live on a noisy, busy street so had to build a decoupled wall on the side that faces the street. It works well. Motorcycles and firetrucks are still loud, tho. Mostly thru other parts of the room like doors and windows, not the decoupled wall.
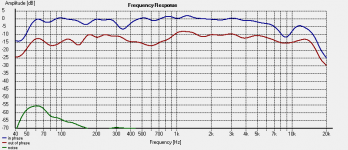
Below is the same graph at an expanded scale closer to yours, Markus.
That noise floor is relative to the playback level circa 83dB. I live on a noisy, busy street so had to build a decoupled wall on the side that faces the street. It works well. Motorcycles and firetrucks are still loud, tho. Mostly thru other parts of the room like doors and windows, not the decoupled wall.
Below is the same graph at an expanded scale closer to yours, Markus.
Attachments
That noise level is unusually low. I'm not saying that it's impossible but it doesn't fit the description of living next to a noisy street.
Could you measure with REW's RTA?
Could you measure with REW's RTA?
I don't have that software, but could look for it. I may be able to measure absolute levels with the RTA section of my DEQ2496. Let me dig it out and have a try. I've done that before and IIRC noise was about 50dB C weighted so my graph should have shown noise about 30-35dB below signal, right?
Yeah, more than 10dB is not easily achieved, I learned too. Obviously I missed the center, as the diff gets even louder at the top end (graph is 1/6th-oct smoothing),Looks like between 10-15dB cancellation is the best I can do.
It has to be noted that this is a DSP'd system which helps for flat freq response and for part of the nulling.
- Klaus
Attachments

That looks pretty good Klaus. If you look at the impulses in HOLM (time locked) you can get it even better. It worked for me. Remember to reset the time at each new pair of left/right measurements.
This is why I'm experimenting with multiple tweeters (4), 7kHZ and up, so cancellation nulls get filled in by adjacent drivers, which because of their different physical locations, and therefore time delays, will have their cancellations at differing frequencies. The end result should be a smoother response. I'm doing a 4 tweeter horizontal curved array (somewhat like the Bozak array). It would be too directional if the array wasn't curved (I'm using 20 degrees per increment). It won't fix everything, but it should be noticeably better.The problem is that you get very different readings even when moving the mic just for a few millimeters.
- Status
- Not open for further replies.
- Home
- Loudspeakers
- Multi-Way
- What is the ideal directivity pattern for stereo speakers?