Is it possible to lock a crossover variant? I am working with a few variants for comparison, switching between them. Every now-and-then I find myself editing the wrong one! Putting a lock on the ones that you don't want changed (making them non-editable) would help preventing such mistakes.
Another observation. I had an instance where the L and the series R of an inductor was swapped. It is the inductor in a CLC T-network. When I changed series resistance, the cut-off frequency was affected. The series resistance was acting like the inductance and the inductance was acting like the series resistance. I deleted the inductor and placed a new one in its place. This restored it to normal behaviour.
Just waiting to hear about the inductor observation.
See changelog rev. 2.0.18.1 (2019-05-21):
* DCR of inductor calculated when inductance changed with mouse wheel or up/down buttons. DCR *= (Lnew/Lold)^0.59
* DCR of inductor calculated when wire diameter changed with mouse wheel or up/down buttons. DCR *= (Dold/Dnew)^1.6
This helps maintaining DCR while L adjustement but of course initial value of L, DCR and diameter should be valid for calculation, and final exact DCR should be entered manually. Also this one was the most important feature for someone (else than me).
When I changed series resistance, the cut-off frequency was affected.
I have tried to increase performance of rev 2.0.48.0 by skipping network calculation if X button in component menu is not pressed i.e. user is adding or replacing component. That could be one reason at least for delay in correct result. The latest build this morning takes one small step back; calculates network immediately when component is replaced by pressing Ctrl while clicking another component. This won't probably fix everything...
Swapping between active phase PEQ and IIR PEQ has also bad behavior until some parameter is adjusted. This has been know feature since the beginning.
Last edited:
Is it possible to lock a crossover variant?
Almost everything is doable but I can't give any promises.
See changelog rev. 2.0.18.1 (2019-05-21):
This helps maintaining DCR while L adjustement but of course initial value of L, DCR and diameter should be valid for calculation, and final exact DCR should be entered manually. Also this one was the most important feature for someone (else than me).
I can see the usefulness of such a feature if you knew the size of the wire used in the inductor. It somehow forces you to care about an extra parameter, though.
Is the formula you use applicable to inductors having different core materials (Al)? E.g, air core coil vs iron or ferrite core.
^Exponents are okay for air core with typical geometries. Could be okay also for other materials, but I've never tested. This is not exact math because geometry affects to inductance.
Type value to parameter grid if you want to avoid auto calculation. Also Optimizer does not touch DCR if Opt is not checked.
Type value to parameter grid if you want to avoid auto calculation. Also Optimizer does not touch DCR if Opt is not checked.
Hi Kimmosto:
I am using Vituix to model a CBT line array. Its showing some "blooming" (white regions) in the upper midrange-lower treble of the horizontal polar map independent of whatever I use for driver directivity data. This phenomenon doesn't show up in any of Don Keele's graphs so I wonder if its some kind of simulation artifact. I'll attach a screenshot for you to look at. Further discussion is at the end of this thread
https://www.diyaudio.com/forums/full-range/337956-range-line-array-wall-corner-placement-41.html#post6164403
I know what your attitude is re simulation accuracy for this kind of work. I want to be clear my purpose now is to understand the array behavior. Later I may indeed try to correlate with real measurements but first I need to decide what and if to build.
Also, can you tell me what "show early reflections" shows? I use the room response tab but I can't guess how you define early reflections vs boundary reflections and found nothing in the manual.
I used the driver layout screen to place the 64 drivers on the baffle. For that many drivers it constrains the arch angle. I wanted 60 degrees, it gave me 56.x which I guess is close enough. It would be great if I could specify a larger arc so I could do more virtual experiments.
Thanks in advance for your help!
Jack
Attachments
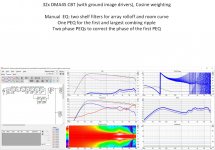
^I can't repeat that clear and constant off-axis peak to lower treble here with standard CBT, without crossover and added mirror sources. Circular baffle and line array with centered driver(s) have some systematic diffraction behavior i.e. humps and dips are not much diffused, but it's not that clear - as you said that peaks are there with any off-axis data.
VCAD calculates in frequency domain with 1/48 octs frequency steps which can't handle e.g. group delay calculation properly with long distance differences between drivers. But pressure summing should work okay so that does not explain. Coordinate system of mic and driver movement were not compatible for boundary reflection calculation in earlier versions, but errors should not occur if Microphone offset was X,Y=0,0.
It looks some artifact or coincidence related to combination of crossover and geometry, but difficult to figure out without revealing project and settings.
"Early reflections" and "Early reflections DI" are specified in ANSI/CTA-2034-A standard. Modified spec:
The early reflections curve is an estimate of all single-bounce, first-reflections, in a typical listening room.
• Floor Bounce: 20º, 30º, 40º down
• Ceiling Bounce: 40º, 50º, 60º up
• Front Wall Bounce: 0º, ± 10º, ± 20º, ± 30º horizontal
• Side Wall Bounces: ± 40º, ± 50º, ± 60º, ± 70º, ± 80º horizontal
• Rear Wall Bounces: +90,+100,...,+180º and -90,-100,...,-170º horizontal
Early reflections response is RMS average of previous five RMS frequency responses.
Hi Kimmosto:
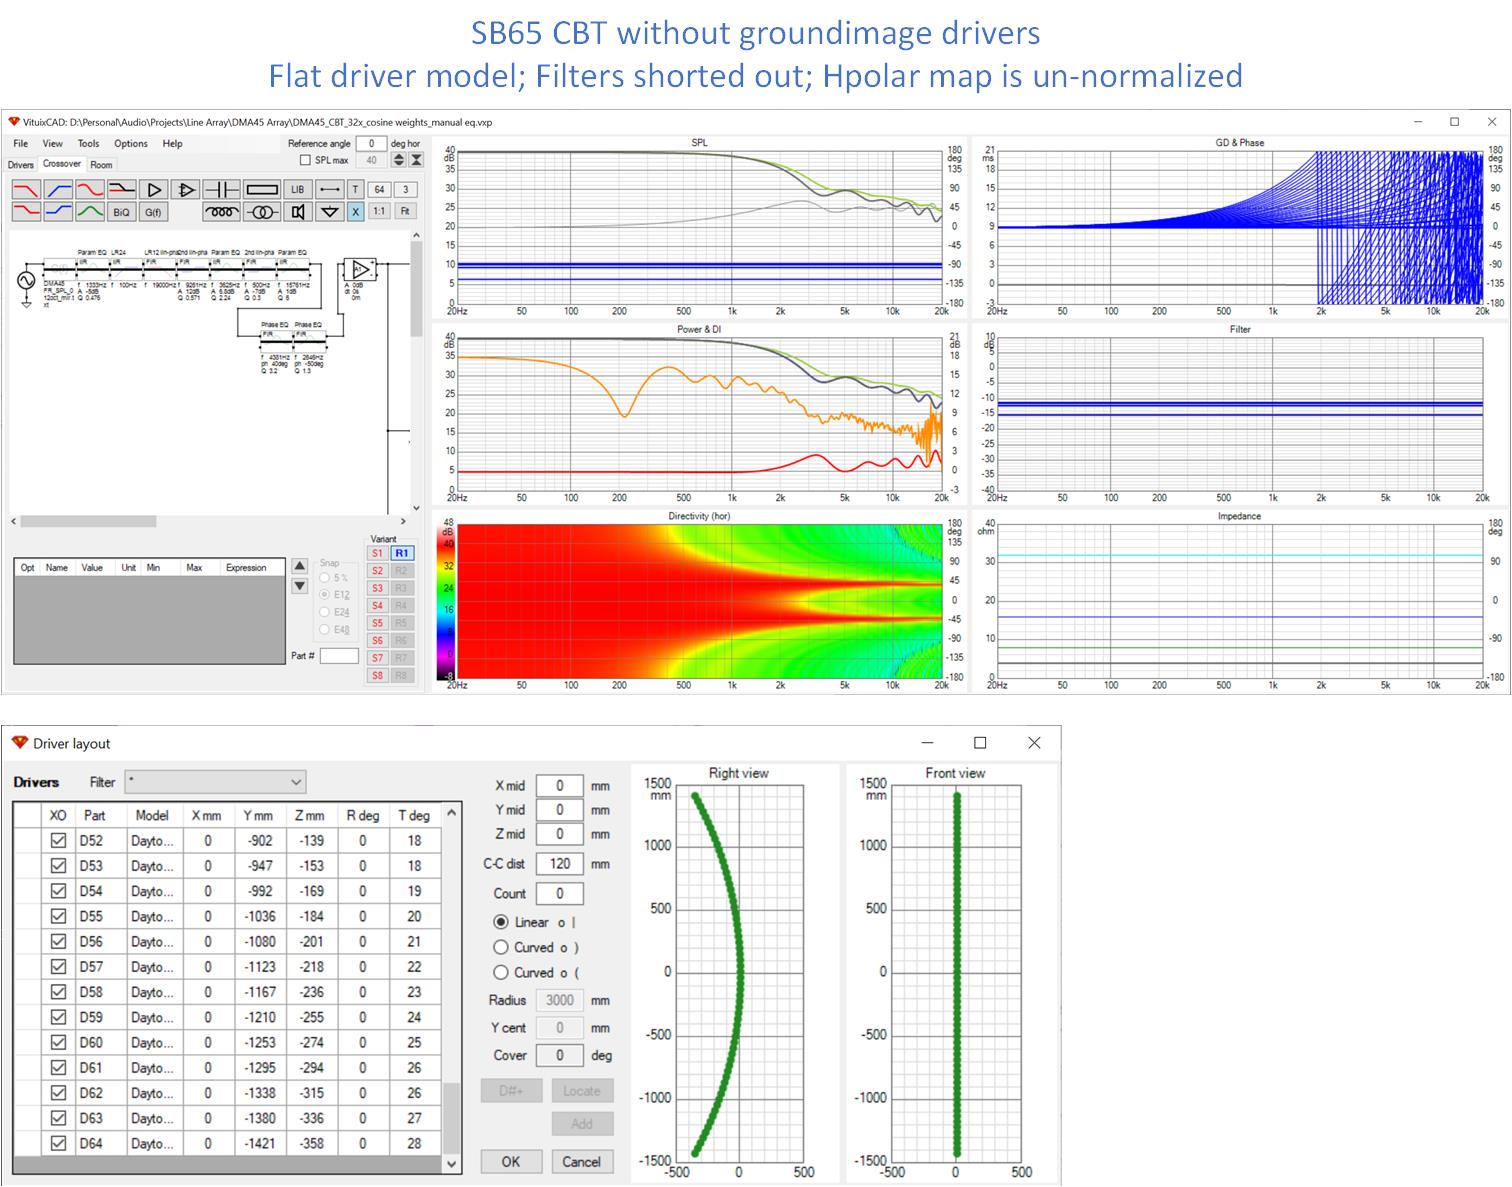
Thanks for a thoughtful response. Removing the ground image drivers is something I should have tried myself but I still see the problem there. I simply disconnected D33-D64 in the schematic and configured the flat driver model. But showing Hpolar map unnormalized made for an interesting and suspicious picture. That picture didn't change when I re-connected the image drivers.
Room response curve has only floor reflection checked
Attachments
Last edited:
^^That design is not normal CBT because listener is close to focal point. Distance from listener/mic to top driver should be the longest with CBT i.e. driver layout should be created with the lowest option o ( where small o is round head and parenthesis/arc is driver array. More positive Z is longer distance from mic to driver, and more negative Z is closer to mic/listener.
I understand that "Right view" could be "Left view" for many of us.
I understand that "Right view" could be "Left view" for many of us.
That would explain a lot! So negative Z is towards the mic?
BTW: I love the way that when I add drivers to an existing design via driver layout screen, they always land on top of components already there. It would be nice if they landed on the right hand half of the available space which is usually clear (although not after adding 64 drivers like I'm about to do 🙂)
Thanks!
That would explain a lot! So negative Z is towards the mic?
That can explain no less than everything 🙂
Yes, negative Z towards the mic. Also this is heritage from LspCAD.
Rev. 2.0.49.0 (2020-04-21)
Power dissipation
* Scaling of Crest factor changed from RMS/RMS (~square) to peak/RMS (~sine). Added red 'Clipped sine!' or 'Square wave!' warning text if Crest factor is below 3 dB i.e. the lowest value for unclipped sine wave.
* Added M-Noise option to Spectrum group. Transfer function is based on measurement from wav file published by Meyer Sound. Crest factor is constant 6 dB.
* Added HPF/LPF option to Spectrum group. Available filters: None, Butterworth 6...48 dB/oct, Linkwitz-Riley 12...48 dB/oct or Pink noise -3 dB/oct (for low-pass only).
* Signals group renamed to Components.
* Added View group for Power and Current selection. Added Voltage option to show terminal voltage instead of power or current. Added peak checkbox to show peak voltage instead of RMS voltage.
A minute ago:
* Fixed crest factor of M-Noise to promised 6 dB. Had some design time ghost.
* Added dBV checkbox to View group to show Voltage in dB with 50 dB span.
* 'Pink noise' low-pass renamed to 'Half order'.
Revision number not upgraded.
* Fixed crest factor of M-Noise to promised 6 dB. Had some design time ghost.
* Added dBV checkbox to View group to show Voltage in dB with 50 dB span.
* 'Pink noise' low-pass renamed to 'Half order'.
Revision number not upgraded.
Doesn't that defeat the purpose of M-noise? Supposedly all about having crest factor that increases with frequency, and is higher than the 12 dB or so typical of pink noise.* Fixed crest factor of M-Noise to promised 6 dB. Had some design time ghost.
Doesn't that defeat the purpose of M-noise?
Yes and no 🙂 I have measured peak / average from Meyer's official wav file with few applications such as REW and ARTA with multiple FFT sizes and bandwidths, and my possibly wrong conclusion is that there is no variable dynamic. Measured peak / average for each fractional octave 20-20k is close to constant ~7 dB. Not 6 dB familiar with ideal pink because "cumulative peak detection" is sensitive to random peaks and average calculation filters them out.
So M-Noise looks just standard pink noise added with few EQ: -2.3 dB/oct extra tilt beginning at ~700 Hz, HPF at 9 Hz and LPF at 22 kHz.
This kind of constant peak / average implementation is totally okay in XO simulator if our target is to optimize power handling of resistors and other components dissipating true power. But simple EQ would not be okay if we are really interested in peak voltage (capacitors) at frequency range where peak / average is significantly higher than somewhere else.
Last edited:
Just succeeded to find tool and method for analysing crest factor of narrow bands. M-Noise actually has variable dynamic (as promised by Meyer) so current implementation in VCAD is valid for power dissipation, average current and voltage, but peak voltage result is not correct. Fixed crest factor is also low for LF, but I will increase that later.
Last edited:
help with cross over design
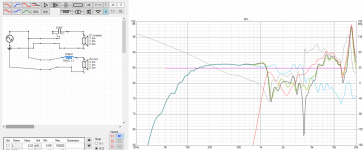
Hello I am a novice speaker builder and this is the first crossover I have designed. Does anyone have advice for me? Any help is welcome. I have large dips and peaks in my SPL graph. How do I straighten them out? I have added a screenshot of what I have designed so far. Thanks in advance!
Hello I am a novice speaker builder and this is the first crossover I have designed. Does anyone have advice for me? Any help is welcome. I have large dips and peaks in my SPL graph. How do I straighten them out? I have added a screenshot of what I have designed so far. Thanks in advance!
Attachments
- Home
- Design & Build
- Software Tools
- VituixCAD