is the frequency response of the lii audio f-15 driver in this software or is it possible to manually add it?
You can simulate response with Enclosure tool by adding driver with T/S-parameters to local database.
Rev. 2.0.43.2 (2020-03-09)
Main
* User's off-axis angles read from project file (vxp).
* Color palette for User's off-axis angles in Directivity Line chart is common to horizontal and vertical views, and insensitive to 'Negative angles in front' and 'Half space' selections.
Main
* User's off-axis angles read from project file (vxp).
* Color palette for User's off-axis angles in Directivity Line chart is common to horizontal and vertical views, and insensitive to 'Negative angles in front' and 'Half space' selections.
Excellent, thanks for quick resolution. 🙂24-bit mono+stereo wav IR export fixed to rev. 2.0.43.1.
Smallest possible reason: 0.00001% too high scaling factor...
Concerning the scale factor used for exporting IR to *.wav, is it possible to use the same scale factor for all signals chosen to export? (ie so the different exported signals would have the correct relative magnitude) or is each one always scaled individually to max possible.
is it possible to use the same scale factor for all signals chosen to export?
It's already doing that when you select multiple Buffer out or Driver in or Driver SPL signals with 'Signals to export' combo boxes and then Export. Driver in and Buffer out i.e. gain signals have common scaling factor, and SPL signals common scaling factor different than gain signals because of different unit.
Scaling factor applies to wav and miniDSP exports. Text and MLSSA exports are unscaled to maintain dB (gain) and dBSPL (Pa) values.
D button lists signals at drivers' terminals and B button outputs of active Buffer blocks. Difference is that B is able to support also semi-active systems with some passive components for the drivers, and IR files for convolver in active section. No button for listing Driver SPL signals because it's not so common as a group export.
That makes perfect sense.It's already doing that ... Driver in and Buffer out i.e. gain signals have common scaling factor, and SPL signals common scaling factor different than gain signals because of different unit.

Revisiting the test case which had prompted my question, I see that I unintentionally had a mixed set of exports.
Rev. 2.0.43.3 (2020-03-11)
Main
* Legend of Directivity chart shown in chart area when User's off-axis angles is checked in context menu.
* Fixed few spelling errors.
Main
* Legend of Directivity chart shown in chart area when User's off-axis angles is checked in context menu.
* Fixed few spelling errors.
Rev. 2.0.44.0 (2020-03-12)
Main
* Bold, underline and frame options added for crossover comment text. Buttons above comment text box.
Calculate T/S parameters
* Added text boxes for frequency axis limits.
Main
* Bold, underline and frame options added for crossover comment text. Buttons above comment text box.
Calculate T/S parameters
* Added text boxes for frequency axis limits.
Hey kimmosto, unfortunately the software crashes in VirtualBox on load and is unusable. Have you tested it in that environment?
The installed windows is current Win10 Home.
If you're game I'm also up for seeing if I can help port it to Mac OS.
Thanks and looking forward to using it 🙂
The installed windows is current Win10 Home.
If you're game I'm also up for seeing if I can help port it to Mac OS.
Thanks and looking forward to using it 🙂
Hello colleagues! The discussion is very large and it’s hard for me to read it in English. Sorry for the simple question!
How to extract the minimum phase from acoustic measurements with a microphone and a distance of one meter? Thanks!
Oleg
How to extract the minimum phase from acoustic measurements with a microphone and a distance of one meter? Thanks!
Oleg
Hey Kimmosto, first of all, thank you - I often use VituixCAD for my speaker research and reviews.
Second I wanted to make you aware of a potential issue with how VituixCAD calculates the Early Reflections curve from CTA-2034A
Recently over on ASR we've been having a discussion about some ambiguities and apparent typos in the CTA-2034A standard, as spotted by member Dave Zan. Of particular note is the process for calculating the Early Reflections (and by extension, ERDI) curve. You can read my breakdown of the issues here, but long story short the questions were:
1) Does the rear portion of the ER curve only include 3 angles (180, +90, -90), or 19 angles (everything from 90 to -90).
2) Is the standard calculated as a single average of the listed measurements, or do you average each "portion" of the ER curve first (ceiling, floor, front, side, rear) and then average the 5 averages.
I noticed VituixCAD appears to only use 3 rear angles and performs a single average of all the angles (26 angles total) . We eventually got Todd Welti of Harman to [chime in](Spinorama! (also known as CTA/CEA 2034 but that sounds dull, apparently) | Page 3 | Audio Science Review (ASR) Forum) and clarify that Harman calculates the ER curve using all 19 rear angles, and does indeed performs an average of the 5 averages. This has the effect of weighing vertical measurements and rear measurements significantly more heavily than in a simple average using 3 rear curves.
For an example of how this may play out in practice, here is the Dutch & Dutch 8C I recently measured. In white are the VituixCAD-produced curves vs doing it as Welti clarified in blue:
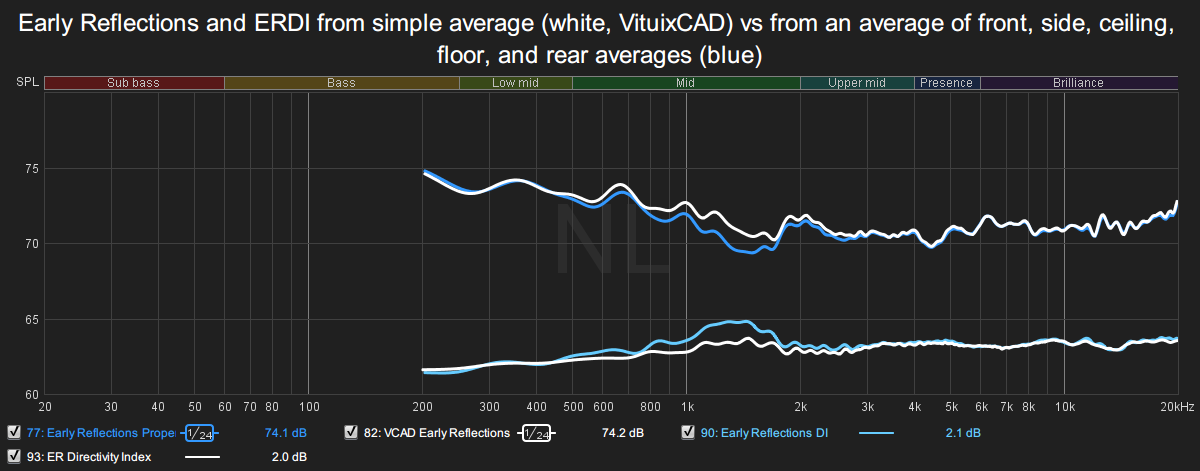
You can see there is a small but significant effect on the curves around the crossover region due to the greater weighting of the vertical measurements. Given Welti's clarification, you might want to process the curves using this method instead for consistency with other measurements. I hope the procedure is clarified in the upcoming CTA-2034B because it's quite ambiguous as written.
Thanks for hearing me out!
Second I wanted to make you aware of a potential issue with how VituixCAD calculates the Early Reflections curve from CTA-2034A
Recently over on ASR we've been having a discussion about some ambiguities and apparent typos in the CTA-2034A standard, as spotted by member Dave Zan. Of particular note is the process for calculating the Early Reflections (and by extension, ERDI) curve. You can read my breakdown of the issues here, but long story short the questions were:
1) Does the rear portion of the ER curve only include 3 angles (180, +90, -90), or 19 angles (everything from 90 to -90).
2) Is the standard calculated as a single average of the listed measurements, or do you average each "portion" of the ER curve first (ceiling, floor, front, side, rear) and then average the 5 averages.
I noticed VituixCAD appears to only use 3 rear angles and performs a single average of all the angles (26 angles total) . We eventually got Todd Welti of Harman to [chime in](Spinorama! (also known as CTA/CEA 2034 but that sounds dull, apparently) | Page 3 | Audio Science Review (ASR) Forum) and clarify that Harman calculates the ER curve using all 19 rear angles, and does indeed performs an average of the 5 averages. This has the effect of weighing vertical measurements and rear measurements significantly more heavily than in a simple average using 3 rear curves.
For an example of how this may play out in practice, here is the Dutch & Dutch 8C I recently measured. In white are the VituixCAD-produced curves vs doing it as Welti clarified in blue:
You can see there is a small but significant effect on the curves around the crossover region due to the greater weighting of the vertical measurements. Given Welti's clarification, you might want to process the curves using this method instead for consistency with other measurements. I hope the procedure is clarified in the upcoming CTA-2034B because it's quite ambiguous as written.
Thanks for hearing me out!
^Thanks for information. That fully explains why ER and ERDI per CTA-2034A (how it is written) have been useless in my opinion.
Hello Kimmo, how it works dual added mass. Some informations about this method, or pappers, link.
Thank you
Thank you
^Status of Dual added mass method is "preliminary for evaluation". I will add frequency-dependent suspension compliance parameters (columns) R0, C0 and creep beta to driver database for radiator simulation when precision of calculation is verified.
Links/references to AES papers are listed in user manual, but those are not free for other than members. One good information source and training room is speakerbench.com maintained by Futtrup.
Also REW already has dual added mass method. User manual of REW includes short instructions for measurement order: burn-in -> mass 2 -> mass 1 -> free air. Small difference to VCAD is that REW is using Ritter 3PC model for suspension compliance. It's more advanced, but difference to LOG model is not much especially if radiators are finally simulated with Rms and Cms i.e. traditional simple T/S model with fixed compliance.
Last edited:
Rev. 2.0.45.1 (2020-03-19)
Main
* Whole rear sector (+90...180...-90 deg) included in Early reflections response. Early reflections total calculated as RMS of five separate RMS: front wall, side wall, rear wall, floor and ceiling bounces.
Rev. 2.0.45.0 (2020-03-19)
Calculate T/S parameters
* Added dual-added-mass method by Candy and Futtrup including suspension compliance with LOG model by Knudsen and Grue Jensen. Note! LOG model parameters R0, C0 and β are not yet added to driver database for radiator simulation.
napilopez, could you make new comparison with ER+ERDI? Need to verify that RMS is okay for both averaging steps because RMS and simple pressure average give different results.
^Help files could have something useful
***Thanks!
That is ... Step by step!
1. Download the measured data to the calculator!
2. Click on Minimum phase A.
3. Save the file with a minimum phase!
Right!?
Rev. 2.0.45.1 (2020-03-19)
Main
* Whole rear sector (+90...180...-90 deg) included in Early reflections response. Early reflections total calculated as RMS of five separate RMS: front wall, side wall, rear wall, floor and ceiling bounces.
Rev. 2.0.45.0 (2020-03-19)
Calculate T/S parameters
* Added dual-added-mass method by Candy and Futtrup including suspension compliance with LOG model by Knudsen and Grue Jensen. Note! LOG model parameters R0, C0 and β are not yet added to driver database for radiator simulation.
napilopez, could you make new comparison with ER+ERDI? Need to verify that RMS is okay for both averaging steps because RMS and simple pressure average give different results.
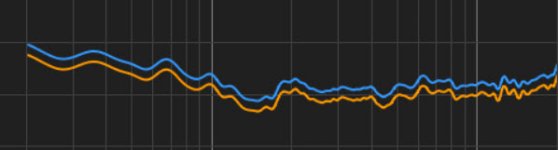
Thanks a ton for the swift update! It now matches exactly to what I get computing the average in REW.
I think RMS is fine. CTA-2034A does specify a power average for all of the averages. I'll inquire to be sure though.
Attachments
Kimmosto, asked Welti and he says his understanding is it's an RMS at both steps. Thanks again!
Last edited:
- Home
- Design & Build
- Software Tools
- VituixCAD