Hi kimmosto,
Thanks message few posts back and all the hard work for practical improvements and maintenance of software, can see now whatever graph line mouse hover over is highlighted thats nice but i miss few days ago say v2.0.37.0 or so i could mouse schroll curves up and down in "Power & DI" window, well not the program calculated curves but manual added overlays or "Take snapshot" curves schrolled practical up and down there, so will ask shall i look in MS Windows settings or mouse software or is it VC that no longer support that feature.
Thanks message few posts back and all the hard work for practical improvements and maintenance of software, can see now whatever graph line mouse hover over is highlighted thats nice but i miss few days ago say v2.0.37.0 or so i could mouse schroll curves up and down in "Power & DI" window, well not the program calculated curves but manual added overlays or "Take snapshot" curves schrolled practical up and down there, so will ask shall i look in MS Windows settings or mouse software or is it VC that no longer support that feature.
Hi Kimmosto,
Thanks for your excellent software.
i have a problem, when i'm trying to load diffraction data on frequency response i got this message:" 68 duplicate direction not loaded. Verify integer multiplier of Angle pressing in Option window." integer multiplied is set on "1" and angle step on 10.
what i wrong😉
bert regards
Luigi
i could mouse schroll curves up and down
That has been an issue with Windows 7. At least the latest updates of 7 do not send mouse wheel events to .NET picture box though mouse cursor is above. No idea how to fix that. Windows 10 is working platform.
integer multiplied is set on "1"
Is it possible that you have exported responses from Diffraction with different angle multiplier than you read them to main program? That is now possible because angle multiplier travels inside project file (vxp) and could change when other project is loaded while Diffraction tool is continuously open.
Could you find and tell few exported filenames for example for 10 deg and 100 deg?
Thanks, i found this thing. if i export diffraction without save baffle (in diffraction tool)all work correctly. iF i export diffraction after save baffle, i have errors.
Anyway I found a way 😉
all the best
Luigi

Hi Defo,
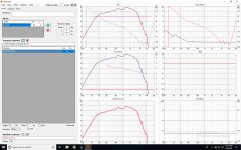
For that situation to look for clues myself would be curios see how those three txt-files 0/30/60 deg look on their own especially if that 30 deg one differ from the two others in for example its SPL number and how curve tendency look, we can read them three txt-files many ways by their own or overlaid, on their own rightclick on VC in processline and open VC one more time and load 0 deg, then repeat the same for 30 and 60 deg so now you have four times VC running hover mouse over them down on process line and one can look for any differences between 0/30/60 deg files. Also they can be overlaid if you rightclick in "Power & DI" window or use REW to look them overlaid in "All SPL" tab.
For that situation to look for clues myself would be curios see how those three txt-files 0/30/60 deg look on their own especially if that 30 deg one differ from the two others in for example its SPL number and how curve tendency look, we can read them three txt-files many ways by their own or overlaid, on their own rightclick on VC in processline and open VC one more time and load 0 deg, then repeat the same for 30 and 60 deg so now you have four times VC running hover mouse over them down on process line and one can look for any differences between 0/30/60 deg files. Also they can be overlaid if you rightclick in "Power & DI" window or use REW to look them overlaid in "All SPL" tab.
Hi Defo,
For that situation to look for clues myself would be curios see how those three txt-files 0/30/60 deg look on their own especially if that 30 deg one differ from the two others in for example its SPL number and how curve tendency look, we can read them three txt-files many ways by their own or overlaid, on their own rightclick on VC in processline and open VC one more time and load 0 deg, then repeat the same for 30 and 60 deg so now you have four times VC running hover mouse over them down on process line and one can look for any differences between 0/30/60 deg files. Also they can be overlaid if you rightclick in "Power & DI" window or use REW to look them overlaid in "All SPL" tab.
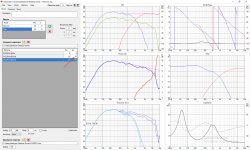
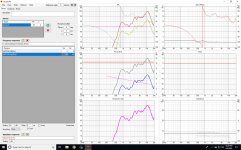
If I've understood you correctly, here's each of the responses imported into VC.
Attachments

If I've understood you correctly, here's each of the responses imported into VC.
Happens with other measurements as well. Here's the AMTPRO with FRD files directly from Parts Express. When I specify the 45 measurement vertically, all goes wacky
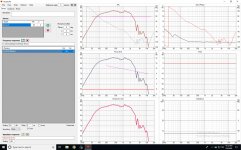
Thanks publish result and i see they look normal in curve and same SPL scale so nothing there, myself don't no anything about code and what is the cause but i'm pretty sure you can manage this problem in a simple way, that is rename whatever hor directivity file you have so they end with below VC convention:
(*****)hor_+0deg.txt
(*****)hor_+30deg.txt
(*****)hor_+60deg.txt
Now make 3 copy set of above and rename as below:
(*****)hor_-0deg.txt
(*****)hor_-30deg.txt
(*****)hor_-60deg.txt
(*****)ver_+0deg.txt
(*****)ver_+30deg.txt
(*****)ver_+60deg.txt
(*****)ver_-0deg.txt
(*****)ver_-30deg.txt
(*****)ver_-60deg.txt
Load all above 12x txt-files for one driver should work to get symetri in all four derectivity sectors -X/+X/-Y/+Y .....🙂
EDIT well i now see 0 deg will be in surplus but VC don't care in it will simply present a dialog that 3 duplicates is not loaded 😛
Last edited:
Single response can be either hor or ver - not both because program provides primarily dual plane acoustical simulation. Mirror missing in Options takes care of the rest. Optional rotation of planes can be done with Planes deg text box in Drivers tab.
Reading "How to start..", measurement instructions and user manual should help. File naming rules and angle coding+parsing explained more than once.
Reading "How to start..", measurement instructions and user manual should help. File naming rules and angle coding+parsing explained more than once.
Last edited:
Rev. 2.0.42.0 (2020-03-05)
Main
* Added Interpolate checkbox to Frequency responses group in Options window. Frequency responses are interpolated between off-axis angles and planes loaded to drivers when Interpolate is checked. Program selects the closest off-axis angle loaded to driver when Interpolate is unchecked. This could cause some errors and discontinuities.
* Added "0 deg" option to Angle step combo box in Options window. Off-axis angles loaded to drivers are simulated when "0 deg" is selected.
VC convention
Plane is interpreted as horizontal if keyword for vertical plane is not found in filename. "deg" and "+" sign are ARTA-style, but not required by VCAD because e.g. my main gear is CLIO.
Few examples with Angle multiplier=1 in Options window:
"blaablaablaa ver 20.txt" equals to vertical +20 deg
"blaablaablaa hor +45.txt" equals to horizontal +45 deg
"blaablaablaa hor -90.txt" equals to horizontal -90 deg
"blaablaablaa@30.frd" equals to horizontal +30 deg, because ver is missing.
Few words about 2.0.42.0:
Unchecked Interpolate and Angle step = 0 deg in Options window turn off-axis response handing and power and directivity curves quite close how they were in versions 0.1-1.0-1.1 up to 2.0.20.0 (2019-08-20).
Interpolation (added to 2.0.21.0 2019-08-26) has clear advantages with non-circular radiators, and produces smooth response transition while driver position, mic position, mic distance and mic angle changes. Without interpolation response jumps when exit direction changes enough.
With previous versions interpolation was possible to disable by setting listening distance to 99900 mm, but that trick is not needed anymore.
Off-axis angles according frequency response files loaded to drivers could help with simple projects and studies when full off-axis measurement sequence is not productive enough. Designer could also be so (over)confident (old dog) that full response set is not needed to get balanced sound 🙂
I've already switched to commercial so it's not my mission anymore to restrict and lecture experienced customers what is adequate design method - though it could be better service.
Rev. 2.0.43.0 (2020-03-06)
Main
* Added Aspect ratio dB/dec to Image export group in Options window. Enables calculation of image height by image width and SPL Span and frequency axis limits.
* Highlighting of curve in Directivity chart is possible to lock by clicking the curve. Unlock highlight by clicking chart area again.
* Maximum brightness of curves in Directivity (Line) chart limited to improve contrast with white background.
...additions this morning 9:03 GMT+0:
* Response to Reference angle is shown in black in Directivity Line chart.
* User's off-axis angles saved to project file (vxp).
* Response to Reference angle is shown in black in Directivity Line chart.
* User's off-axis angles saved to project file (vxp).
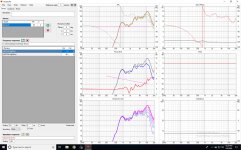
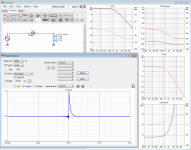
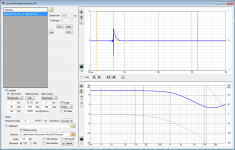
Recently noticed what I think is a bug with the IR export feature. See attached example of exporting an IR for a simple LP filter and then reading it back in with the IR to FR tool. Note that the single sample at peak value of 1 has been set to -1 in the exported file. The remainder of the impulse looks to be fine.
BTW, imported *.wav looks similar with ARTA and REW, so I believe it is the export that is the problem not the import.
BTW, imported *.wav looks similar with ARTA and REW, so I believe it is the export that is the problem not the import.
Attachments
is the frequency response of the lii audio f-15 driver in this software or is it possible to manually add it?
Recently noticed what I think is a bug with the IR export feature.
Yes, there is some bug in both 24-bit PCM wav exports. Maybe some issue in byte order of truncated word. All 16-bit, 32-bit and 64-bit PCM exports seem to work okay.
24-bit mono+stereo wav IR export fixed to rev. 2.0.43.1.
Smallest possible reason: 0.00001% too high scaling factor caused one bit overflow -> sign error to peak sample. Error is still possible due to rounding. Please let me know if that happens and I will reduce gain to be compatible with 16-bit PCM wav (max value=32760).
Smallest possible reason: 0.00001% too high scaling factor caused one bit overflow -> sign error to peak sample. Error is still possible due to rounding. Please let me know if that happens and I will reduce gain to be compatible with 16-bit PCM wav (max value=32760).
Last edited:
- Home
- Design & Build
- Software Tools
- VituixCAD