* BL is a bit more accurate.
* No need to measure Re.
Difference to single added mass is usually insignificant so dual mass is not so important for diyers and box designing IMO. Knowing accurate BL and Mms would be more important for driver manufacturers assuming that individual test samples represent whole production. Unfortunately that is not common.
Knudsen LOG model and others including suspension creep is not the same as simulation with standard T/S parameters having constant Cms and Rms. Simulation with suspension creep needs simulator supporting creep parameters - R0, C0 and Creep Beta in this case. In practice it's not easy to use parameters calculated with 'LOG model' checked outside VituixCAD Enclosure.
Interesting, is there an optimum between added masses?
I have been trying a bunch, but the Re is still way off compared to my 5 digit table top meter.
Also, I assume that the third mass in VituixCAD is the total mass again like the second one?
edit: also the more I click on calculate, the lower the Re value goes when re-calculating?
Until even a ridiculous values under the actual Re value
Last edited:
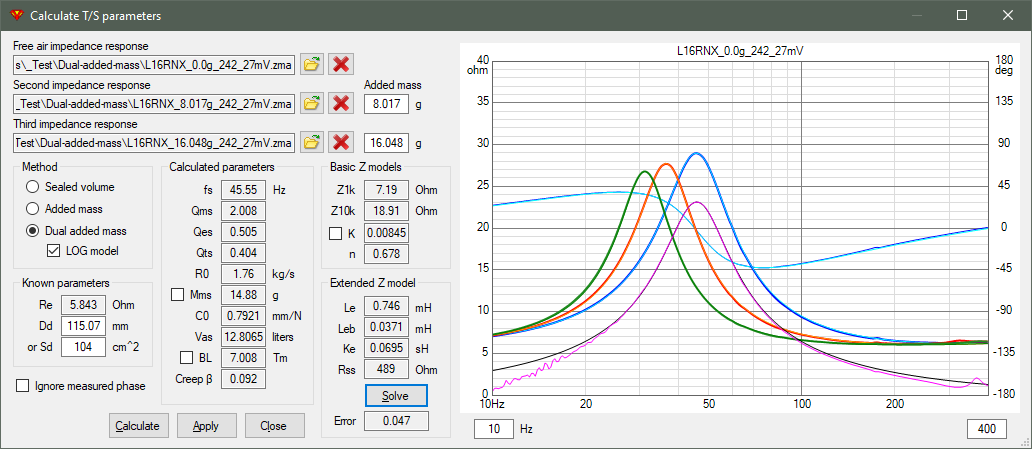
It's safest to test and validate this method and features with impedance responses of Seas L16RNX-8 measured at Seas lab. Read about method and download three ZMA files from here:
Speakerbench Manual
Result with VCAD is also visible in user manual:
It also easy to compare results between VituixCAD and speakerbench.com which is kinda "official" site for dual added mass.
Speakerbench Manual
Result with VCAD is also visible in user manual:
An externally hosted image should be here but it was not working when we last tested it.
It also easy to compare results between VituixCAD and speakerbench.com which is kinda "official" site for dual added mass.
I understand, I will read into it, but it still doesn't explain the big difference in Re value?
I am talking about more than 0,5-1 ohm on a Re of 5,6ohm
I have calibrated my setup for measuring impedance with known accurate values, as well as alternative (manual) methods. So I know for sure that my setup can be trusted.
Besides the fact that these are errors way bigger than any normal calibrated setup.
edit: One good explanation, is that Seas uses an AC measurement for Re as well in their datasheets.
Usually that value will always measure a little higher than de straight DC Re value
Last edited:
Actually looking at the LOG model, I find the C0 value confusing.
Usually it is being used for the static compliance, but in this case I think it's just another dynamic compliance?
For a static compliance this LOG C0 value is way to small
I have done some extensively research and tests on the static and dynamic compliance myself, and usually you're close to a factor 1.5-2
A good read on this is the following document;
"Modeling Viscoelastic Properties of Loudspeaker Suspensions Using Fractional Derivatives "
Modeling Viscoelastic Properties of Loudspeaker Suspensions Using Fractional Derivatives - Archive ouverte HAL
https://hal.archives-ouvertes.fr/hal-02504339/document
edit: One good explanation, is that Seas uses an AC measurement for Re as well in their datasheets.
Usually that value will always measure a little higher than de straight DC Re value
I just double checked this again.
With tweeters, two octaves under Fs, and I am right on the money.
One octave could also work for just tweeters.
With an old mid-range with a Fs of around 300Hz, it's also just about ok one octave lower.
For woofers this is more difficult, since their Qt is usually low, so you will always introduce an error, unless you're gonna measure around 0.5Hz
Unfortunately ARTA (LIMP) doesn't go that low.
For a static compliance this LOG C0 value is way to small
Already told that R0 and C0 of Knudsen LOG model are not Rms and Cms equivalents i.e. not compatible with traditional T/S calculation. Simulation with R0 and C0 needs own formulas visible in user manual of speakerbench.com.
Calculation of Re with LOG model is based on iteration with impedance response(s). Actual accurate Rdc is not interesting and valuable for system simulation where target is to simulate acoustical transfer function and impedance response. Simulation with traditional T/S uses Rdc, but as we already (should) know, that is less accurate than simulation with creep and iterated Re.
Well, sorry for double checking we are on the same page about C0 or R0 🙄Already told that R0 and C0 of Knudsen LOG model are not Rms and Cms equivalents i.e. not compatible with traditional T/S calculation. Simulation with R0 and C0 needs own formulas visible in user manual of speakerbench.com.
Calculation of Re with LOG model is based on iteration with impedance response(s). Actual accurate Rdc is not interesting and valuable for system simulation where target is to simulate acoustical transfer function and impedance response. Simulation with traditional T/S uses Rdc, but as we already (should) know, that is less accurate than simulation with creep and iterated Re.
If we are going to use some kind of T/S anyway, one should use the Re.
An "AC estimate" of the Re will always by definition be off, depending on the compliance of the driver.
The dynamic compliance even at very low frequencies will be still very significant (see document I referred to before)
So you will measure this on top of the Re in the impedance curve.
If you're going to introduce things like creep, or rather non-linear behavior in the compliance
(I would not call this creep, creep is only a small part of the non-linear behavior), T/S aren't really useful to begin with.
So now it feels very much like just mixing apples with pears all together.
Or in other words, it's rather confusing and very misleading when calling something a Re = DC resistance, when it is actually not.
Especially when manufactures put this in their datasheets without clarifying it.
Rather confusing to use the same name for something that isn't the same.
I agree with you that it could be a more useful parameter.
If we are going to use some kind of T/S anyway, one should use the Re.
Sorry to repeat, but Rms and Cms are fundamental parameters of T/S, but they do not exist in LOG model i.e. you are not using "any T/S" if you check 'LOG model' 🙂
Sorry to repeat, but Rms and Cms are fundamental parameters of T/S, but they do not exist in LOG model i.e. you are not using "any T/S" if you check 'LOG model' 🙂
Technically they still exist in the LOG model, but just with a correction factor.
But this still doesn't answer the issue with standard T/S parameters with a different (wrong?) estimated Re.
Doesn't have anything to do with LOG.
But this still doesn't answer the issue with standard T/S parameters with a different (wrong?) estimated Re.
Method is not suitable for tweeters and microspeakers. Assumption is that measured impedance responses do not start low enough i.e. much below fs to use impedance magnitude at the lowest frequency point as Re.
At the moment Re is calculated around fs as measured free air impedance minus model-free motional impedance minus (iterated) Leb+Le||Rss||Ke (=extended Z model without Re). Other formulas/methods will be considered if better found.
Seas L16RNX-8 has Re=5.8 Ohms on datasheet, and dual added mass method with reference data measured at Seas lab produces currently about 5.826 Ohms in VituixCAD and 5.721 Ohms at speakerbench.com. Result is based on Z measurement starting at 10 Hz which is good catch imo assuming that Rdc of tested driver is close to 5.8 Ohms.
Quasi-linkwitz 3rd order
Peter Comeau said "The acoustic crossover slope that I’ve found successful, time and time again, is what I like to call a 3rd order Linkwitz characteristic. In theory there is no such thing, the Linkwitz-Riley topology pertaining to even order filters only, but the characteristics of a Linkwitz filter, namely a -6dB crossover point and ‘perfect’ phase integration between the low and high pass sections."
Is there a way to use that as a target function in Vituixcad?
Thanks, Paul
Is there a way to use that as a target function in Vituixcad?
I will add it to list boxes in optimizer in a week.
LspCAD 5.25 should also have 3rd order L-R but I can't verify it right now - USB dongle is at home but I'm not. It's probably 1st order + 2nd order Butterworth to get -6 dB at fc.
2.0.74.3 (2021-06-27)
Optimizer
* Added quasi 3rd order Linkwitz-Riley HP/LP target slopes.
LP slope is product of 1st order @fc and 2nd order with fc x 0.899, Q=0.874. This produces very flat magnitude sum with perfect phase match e.g. as linear phase.
Phase response of target slope is 3rd order IIR so there will not be ideal phase match between ways if driver responses are ideal with the same acoustical timing.
Hello
My measurement gear were REW, focusrite scarlett 2i2 (3 generation), Dayton Audio emm-6 microphone.
Plan set up semi-dual channel acoustical measurement for my diy speaker.
The question is when I do sound card calibration (left out loopback to 1st input)
Below which one connection cable should be use.
1/4 TRS(output)-1/4 TRS(input) for each end or
1/4 TRS(output)-XLR(input balanced)
Last edited:
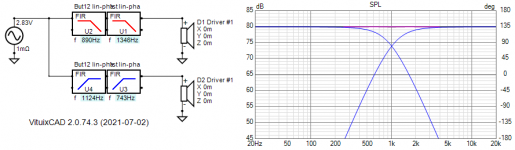
Q=0.874
Typo. Q=0.794. LR3 target magnitude slopes are compatible with this:
Attachments
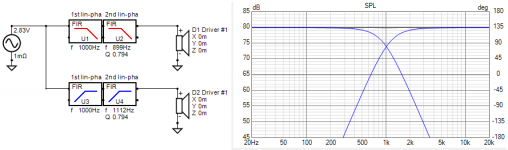
Quasi LR3 targets tweaked today. Now But12 + 1st order, magnitude sum as linear phase (=phase matched) optimized within fc/4...fc*4
Attachments
Last edited:
Member
Joined 2003
Hello
My measurement gear were REW, focusrite scarlett 2i2 (3 generation), Dayton Audio emm-6 microphone.
Plan set up semi-dual channel acoustical measurement for my diy speaker.
The question is when I do sound card calibration (left out loopback to 1st input)
Below which one connection cable should be use.
1/4 TRS(output)-1/4 TRS(input) for each end or
1/4 TRS(output)-XLR(input balanced)
Best to use TRS connection for everything except mic. Phantom power is only present on XLR pins, so there is no worry about putting 48VDC on the wire with TRS connection.
Thanks for the reply.
I will try the TRS connection method and
see what the curve I can found.
I will try the TRS connection method and
see what the curve I can found.
Quasi/odd order Linkwitz-Riley targets finalized.
2.0.74.4 (2021-07-04)
Optimizer
* Added quasi 5th and 7th order Linkwitz-Riley HP/LP target slopes.
This has generated questions also to my e-mail so few comments:
Basic idea is of quasi/odd order Linkwitz-Riley target slopes is to offer useful targets for phase matched odd order filters. In practice those three could be more valuable than any Butterworth or Bessel targets because phase matching at XO range is much more common than phase mismatch of 90 degrees or so. Phase match with odd order is not that difficult in practice also with IIR filters because acoustical centers of different drivers are usually not at the same distance from listening point. For example when acoustical center of woofer is further than tweeter's, delay of woofer could match phase at XO range so that acoustical LR3, LR5 or LR7 could produce close to flat magnitude sum towards listening point.
Last edited:
- Home
- Design & Build
- Software Tools
- VituixCAD