^Ok. I will add Dark mode checkbox to Display group in Options window. That helps also programming and testing.
Rev. 2.0.75.9 (2021-08-03)
Main
* Added 'Dark mode' checkbox to Display group in Options window.
* Detection of High contrast setting removed. Toggle Dark mode in Options if needed to get suitable colors for selected theme.
* Added Dark mode support to Top and Side images in Room tab.
Also wires and components in crossover schematic are now lighter while dark mode.
hi kimmosto
hi kimosto
why is your sofware need Qts run 0.2 - 0.7
but i have driver have Qts more than 0.7 ( Qts 0.8)
see picture
please tell me more

thank you
hi kimosto
why is your sofware need Qts run 0.2 - 0.7
but i have driver have Qts more than 0.7 ( Qts 0.8)
see picture
please tell me more
thank you
User manual: "...alignment is done with basic formula: Vb = Vas / ((Qtc/Qts)^2-1)"
so the lowest Qtc with auto alignment is Qts which equals to infinite box volume / free air.
In practice filling material enables Qtc < Qts. That is possible to simulate by decreasing Qa.
so the lowest Qtc with auto alignment is Qts which equals to infinite box volume / free air.
In practice filling material enables Qtc < Qts. That is possible to simulate by decreasing Qa.
has anyone happened to have some disparity when loading time locked measurements from holm impulse i.e. when mic is in one position and drivers are measured on tweeter axis , I get quite substantial mismatch when summing in vituix and measuring... individual drivers look correct, but phasing is not. Xsim doesnt have that problem. Is there some trickery when exporting from holmimpulse or is it something inherent to the software? I use an earthworks xlr mic, and an m-audio interface, so delay is constant.
^All driver instances in crossover schematic must be located in X,Y,Z=0,0,0 mm if measurement data is captured at single mic position and you expect the same result with XSim. Very basic XO simulators such as XSim don't have any geometry calculation so measurement data cannot be moved in 3D space by driver location.
why is your sofware need Qts run 0.2 - 0.7
See Loudspeaker Design Cookbook by Vance Dickason, 7th edition, pages 64-67. Alignment tables end to Qts=0.70. Nothing above that.
Last edited:
Hey Kimmo, Your support to people in this hobby is really remarkable as is VituixCAD! I just sent a small appreciation donation to your paypal and just wanted say thank you. I would like to encourage others to do the same.
Carry on.
Carry on.
Member
Joined 2003
I wrote this document this morning, detailing a simplified process for generating off-axis data in VituixCAD. This process allows for use of measured on-axis data to generate simulated off-axis data with a good degree of accuracy. This process may be useful for "quick simulation" without the extra work of manually measuring off-axis data, and in my case it was used to generate only vertical polar data for an AMT driver that would have otherwise been difficult to achieve. Enjoy 🙂
Attachments
Hi,
What are the co-ordinates of mic when listening distance is kept as 2000mm in Menu->Options->Listening Distance ?
Thanks and Regards,
WonderfulAudio
What are the co-ordinates of mic when listening distance is kept as 2000mm in Menu->Options->Listening Distance ?
Thanks and Regards,
WonderfulAudio
Member
Joined 2003
Hello All,
I was reading instructions on how to measure with REW. It says that in VituixCAD options I should set simulated listening distance to more than 2500mm.
What happens if I need to simulate a desktop monitor at 1000mm? Is there any special measurment requirement or any inconvenience?
Regards,
Querbx
I was reading instructions on how to measure with REW. It says that in VituixCAD options I should set simulated listening distance to more than 2500mm.
What happens if I need to simulate a desktop monitor at 1000mm? Is there any special measurment requirement or any inconvenience?
Regards,
Querbx
Member
Joined 2003
The documents should really be updated to read "don't set shorter than 2000mm". I believe the reasoning is to ensure that simulation occurs in the "far field" for accuracy of the power and DI plots. You can certainly simulate at a shorter distance, but charts like power response, in-room response, etc may be a little skewed.
Kimmo may be able to provide further insight, official support is over at HTGuide forum.
Kimmo may be able to provide further insight, official support is over at HTGuide forum.
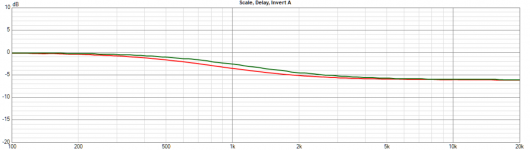
I have a question about the 1st order shelving parameters.
When only a single frequency is used, this is usually take from the -3dB point.
So with a simple -6dB shelving filter, with frequency of 1200Hz, this should be at -3dB.
However, I think there is a little mistake, it's now at -4dB (or 2dB less relative to the -6dB line).
The -3dB point seems to be at 850Hz.
I have checked some other software, and I had no issues with this.
Attached is a graph as a comparison between the two.
Red is VituixCAD
(I had to trace them to put them in the same graph, so there are some tiny little tracing artifacts, but that is not important)
I think this is a visual thing or something?
I also simulated a shelving analog filter, with the opamp block.
Which should give a -3dB of 1200Hz, but in the graph it doesn't?
Analog circuit according to;
Active Filters
edit:
I dove a little deeper, that is a little awkward.
Simulated the circuit in LTSPice as well, same thing, so the other program does something weird.
However, what does the 1200Hz in VituixCAD represent actually?
Because it is not the mid-way frequency nor the -3dB frequency?
Attachments
Last edited:
Member
Joined 2003
The only insight I can provide is that the manual says..."Frequency parameter of Shelving LP/HP filter is dBgain/2."
Unrelated, but you shouldn't need to "trace" anything to show your two plots. Every chart in VituixCAD has the ability to save plots as overlay lines, just right click on them then "save selected as overlay".
Unrelated, but you shouldn't need to "trace" anything to show your two plots. Every chart in VituixCAD has the ability to save plots as overlay lines, just right click on them then "save selected as overlay".
Last edited:
The only insight I can provide is that the manual says..."Frequency parameter of Shelving LP/HP filter is dBgain/2."
Unrelated, but you shouldn't need to "trace" anything to show your two plots. Every chart in VituixCAD has the ability to save plots as overlay lines, just right click on them then "save selected as overlay".
I know, but other programs don't or have such a weird output file, that tracing is quicker 🙂
But anyway. It is working now.
It is equal to Linkwitz' formula for f2
The other programs still uses a wrong definition (which is awkward)
DSP manufacturer decides transfer functions so this has nothing to do with VCAD vs. "the others". For example Behringer, FourAudio and Nova use "analog equivalent" transfer functions for shelving filters i.e. -3 dB at nominal frequency when gain is very high. Hypex, miniDSP, RAM Audio and Xilica use "digital/RBJ equavalent" transfer functions where nominal frequency is always at dBgain / 2.
Also transfer function of Bessel HL/LP and Peak/notch filter depend on DSP selection. Difference between analog and digital equivalents is radical so DSP selection must be correct to get correct response.
Also transfer function of Bessel HL/LP and Peak/notch filter depend on DSP selection. Difference between analog and digital equivalents is radical so DSP selection must be correct to get correct response.
- Home
- Design & Build
- Software Tools
- VituixCAD