Oh great, another "standard" that no-one agrees on.
Kinda weird of course, equivalent mathematical equations, just a different definition.
In the end it's just rather silly and very confusing for the end user.
Kinda weird of course, equivalent mathematical equations, just a different definition.
In the end it's just rather silly and very confusing for the end user.
Member
Joined 2003
I guess, in this case I don't think it matters that much. Set the DSP system in the options, then adjust the filters to achieve the desired transfer function regardless of the specific numbers involved. Just remember that your project design is specific to the DSP system used, changing the DSP system may change the transfer function.
Oh great, another "standard" that no-one agrees on.
Kinda weird of course, equivalent mathematical equations, just a different definition.
In the end it's just rather silly and very confusing for the end user.
Bigger problem is DSP manufacturers who don't use commonly known transfer functions and equations, and calculation of coefficients is not published. Equations could also use different parameters as such Slope or BW instead of analog or digital/RBJ equivalent Q. For example Lake. Their own filter designer is able to show final response, but it's hopeless for the others.
Hypex has biquad coefficient calculation trying to emulate ideal analog transfer functions also with low sample rates. I asked formulas from them, but document did not exist 🙂 So VituixCAD cannot imitate responses exactly. Responses are simply calculated with 192 kHz sample rate also for PSC 48k.
Member
Joined 2003
I found VituixCAD filter calculations to be accurate enough when compared against Hypex Filter Designer for my DSP design. I used the PSC 48kHz setting for my AS2.100D plate amps which also operate at 48kHz. Still trying to decide if upgrading to the Fusion series is worth the CAD$1200 investment for a pair...
I found VituixCAD filter calculations to be accurate enough when compared against Hypex Filter Designer for my DSP design
I found the same thing. If there were differences, it was well within the error band of my microphone.
Member
Joined 2003
No mic required, just compare the transfer function of VituixCAD to HFD using the same filter parameters.
It's not about accuracy, it's about reliability and consistency.
So when one translates settings from one system to another these should match without any problems.
The mathematical equation don't change that's just a fact. So accuracy is not even an argument (except for some very minor rounding errors maybe)
But when manufacturers use different definitions and aren't transparent about it, that will lead to very undesirable situations.
At that point you just don't know anymore what is exactly being used.
One workaround is to do a loop measurement and see if both match.
... or take measurements of the full-up system and then make the inevitable small adjustments. I see that as a necessary quality control step, a final calibration. Saying it is a problem is like saying the necessity of tuning a piano is a problem. Someday the standards may be written such that all digital processors are fully compatible with each other and interchangeable... someday it may not be necessary to tune pianos. But today is not someday.
You're clearly missing the point that ALL digital processors are compatible.
Again, the mathematical equations don't change.
I would recommend working out or looking up a couple of them yourself.
It's the manufacturer's that decide to go for confusing definitions.
I don't understand the example of the piano. The whole point of digital data in general, is to skip that extra step. In production that extra step costs money and time. Less (subjective) human interaction and more predictable results are always better from a production point of view.
yes i am clearly missing the point.
In the meantime, the solution is to
In the meantime, the solution is to
take measurements of the full-up system and then make the inevitable small adjustments
You're clearly missing the point that ALL digital processors are compatible.
Again, the mathematical equations don't change.
FIR and IIR are different, LP filtering for >=Nyquist causes differeces, oversampling could be different, different sample rates with digital biquad (IIR dsp) produce different responses without compensation of frequency warping etc. So digital domain is closer to wild west than known constant without a single difference in definition of LP, HP, shelv, PEQ etc.
That's a very strange way of looking at it.
All mathematical equations are set and stone for the digital domain. There are some rounding issues, but those are just very minor. The rest is all human choice and error.
A 2nd order equation is defined by its shape and exact form. One just needs to copy that form to a different domain and must make sure to keep the errors within a minimum in the relevant passband.
I have done tons of these conversions waaaaay back at my university of applied physics.
For all normal audio filters, one can get easily with margin of error of 1% and often even and order of magnitude better.
Can't edit anymore, but I wanted to add that the only exception is when you go to very high order filters. Think of above 8th order.
Which are not very useful for audio anyway.
As well as way down in amplitude, think of around -50/60dB
Also totally not relevant anymore for any speaker filter.
Which are not very useful for audio anyway.
As well as way down in amplitude, think of around -50/60dB
Also totally not relevant anymore for any speaker filter.
Last edited:
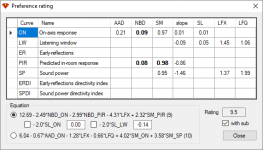
Thank you very much for implementing the "Preference score" function
Dear kimmosto
Thank you very much for implementing the "Preference score" function.
(I am the man who requested on the email and I found you here, so now I can thank you.)
・But hence I am a bit too close to "the" edge on the simulation, I can not see the improvement or deterioration of the individual value and score by the slightest change of parameters anymore.
I know it means virtually nothing, but as my nature, I need to do my best, by changing parameters bit by bit.
So please show me another digit.
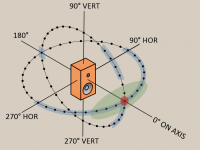
・I understood that discrepancy of ER_Total and PIR from Klippel's calculation, it mainly caused by the interpretation of "Rear wall bounces" due to the ambiguous description of the CTA/CEA-2034-A.
(VituixCAD uses the power average of hor_90~hor_180~hor_-90, probably 5deg increment 73 measurements, whereas Klippel might using hor_90 and or_180 and hor_-90, 90deg increment 3 measurements.)
I doubted VituixCAD at first if I'm honest (because it is Klippel), but now I calculated on my own spreadsheet, and I think you might be on the right side, so I am very sorry.
I'm looking for a more ambiguity-less description in the CTA/CEA-2034-B.
・"Ref angle" still behaves a bit strange when the "angle step" is set to 0 (raw value).
・Looong press enter key needed for suppressing over a thousand "Phase is missing" caution on the opening (some of my sample data do not have phase) so, please consider something like "ok to all".
Dear kimmosto
Thank you very much for implementing the "Preference score" function.
(I am the man who requested on the email and I found you here, so now I can thank you.)
・But hence I am a bit too close to "the" edge on the simulation, I can not see the improvement or deterioration of the individual value and score by the slightest change of parameters anymore.
I know it means virtually nothing, but as my nature, I need to do my best, by changing parameters bit by bit.
So please show me another digit.
・I understood that discrepancy of ER_Total and PIR from Klippel's calculation, it mainly caused by the interpretation of "Rear wall bounces" due to the ambiguous description of the CTA/CEA-2034-A.
(VituixCAD uses the power average of hor_90~hor_180~hor_-90, probably 5deg increment 73 measurements, whereas Klippel might using hor_90 and or_180 and hor_-90, 90deg increment 3 measurements.)
I doubted VituixCAD at first if I'm honest (because it is Klippel), but now I calculated on my own spreadsheet, and I think you might be on the right side, so I am very sorry.
I'm looking for a more ambiguity-less description in the CTA/CEA-2034-B.
・"Ref angle" still behaves a bit strange when the "angle step" is set to 0 (raw value).
・Looong press enter key needed for suppressing over a thousand "Phase is missing" caution on the opening (some of my sample data do not have phase) so, please consider something like "ok to all".
Attachments
・Cant change "Driver traces" except for the first 6 drivers.
Somehow the window does not show other drivers.
(I am putting many drivers for simulating multiple conditions such as the different centres of the sphere.)
Somehow the window does not show other drivers.
(I am putting many drivers for simulating multiple conditions such as the different centres of the sphere.)
@ Noviceman
That Preference score looks very impressive!
Can you share details on the system - drivers, baffle/enclosure and such?
That Preference score looks very impressive!
Can you share details on the system - drivers, baffle/enclosure and such?
...it means virtually nothing
For example NBD_PIR is sensitive to slope: higher tilt of frequency response produces lower score compared to horizontal response with equal variations so better result with 3rd decimal does not necessarily mean better sound. Opposite behavior of PR is not probable, but I don't recommend to be blind and deaf with it.
I understood that discrepancy of ER_Total and PIR from Klippel's calculation, it mainly caused by the interpretation of "Rear wall bounces" due to the ambiguous description of the CTA/CEA-2034-A.
Final version of ANSI/CTA-2034-A specifies clearly:
"Rear: ± 90°, ± 100°, ± 110°, ± 120°, ± 130°, ± 140°, ± 150°, ± 160°, ± 170°, 180° horizontal, (i.e.: the horizontal part of the rear hemisphere)" so Klippel should have the same information.
"Ref angle" still behaves a bit strange when the "angle step" is set to 0 (raw value).
I haven't found any strange behavior. Ref angle text box accepts and steps angles listed in Drivers tab if 0 deg angle step is selected in Options so it could jump and have limits if measurement data is not full/mirrored with constant step.
Looong press enter key needed for suppressing over a thousand "Phase is missing"
That is learning experience to avoid bad data in the future 😉 3-column format is expected default in everything in this scene.
・Cant change "Driver traces" except for the first 6 drivers.
I'm aware that different driver instances of the same driver model could have quite different responses in some mechanically complex and asymmetrical multi-driver constructions. More than six colors could serve these cases, but not e.g. line arrays which can be simulated with common response data for each driver model.
Usually six driver models with six different frequency response sets is adequate. For example each way of 6-way speaker can have own color and data, and different instances of the same driver model have common color and data. Each driver model can have multiple driver instances (with different location and rotation parameters X,Y,Z,R,T) in the crossover.
Thank you for replying.
https://www.klippel.de/fileadmin/kl...erature/Papers/Klippel_Holographie_Poster.pdf
2034-A says
And at following "Horizontal reflections" section, it says
In addition, Dr. Floyd E. Toole says in the Sound Reproduction (Third Edition) P.133
At first time I thought the "Rear wall bounces" in the "The early reflections" section and the "Rear" in the "Horizontal reflections" section are two different things with different definitions but now, I really do not know. 😕
I wanted to put different data with different measurement conditions because using X,Y,Z,R,T strongly depends on interpolation between just two annuli.
I know, I just want a record-breaking score. 🙂better result with 3rd decimal does not necessarily mean better sound. Opposite behavior of PR is not probable, but I don't recommend to be blind and deaf with it.
Well, a friend of mine with hawk eyes found this (blue over ray), and they definitely have a different interpretation.Klippel should have the same information.
https://www.klippel.de/fileadmin/kl...erature/Papers/Klippel_Holographie_Poster.pdf
2034-A says
o Side wall bounces: average of ± 40º, ± 50º, ± 60º, ± 70º, ± 80º horizontal
o Rear wall bounces: average of 180º, ± 90º horizontal
in the "The early reflections" section, and logically speaking, the " Rear wall bounces" should be 180º "and" ± 90º horizontal.o Rear wall bounces: average of 180º, ± 90º horizontal
And at following "Horizontal reflections" section, it says
3. “Rear” is defined as the average of 19 measurements at 180 degrees off the main-axis ±90 degrees (i.e.: the horizontal part of the rear hemisphere).
.In addition, Dr. Floyd E. Toole says in the Sound Reproduction (Third Edition) P.133
Any predictive scheme involving sound power requires the full spinorama of 70 curves.
If the loudspeaker under test is a horizontally symmetrical forward-firing design the earlyreflections calculation involves only 18 (note: probably mistaken of 17) measurements to embrace the floor, ceiling, one side wall, rear and front wall reflection estimates.
Asymmetrical designs require both side walls and both left and right front-wall data points, bringing the sum to 26 measurements.
All but one of these (the 180° measurement) are in the front hemisphere.
At first time I thought the "Rear wall bounces" in the "The early reflections" section and the "Rear" in the "Horizontal reflections" section are two different things with different definitions but now, I really do not know. 😕
I put 1 deg increment data and it behaves strangely, or putting 1 deg increment data itself is the strange behaviour I guess 😀.I haven't found any strange behavior.
I know, but sample data from the web does not. (Mainly putting Klippel data for comparison. I should use the same formulae for consistent evaluation)That is learning experience to avoid bad data in the future 😉 3-column format is expected default in everything in this scene.
Indeed.Usually six driver models with six different frequency response sets is adequate... Each driver model can have multiple driver instances (with different location and rotation parameters X,Y,Z,R,T) in the crossover.
I wanted to put different data with different measurement conditions because using X,Y,Z,R,T strongly depends on interpolation between just two annuli.
Thanks, this model is based on the Ekta by Troels Gravesen, same 12M and 18W in a ported enclosure but with Scan-Speak D2104 and plate amplifier with DSP.Can you share details on the system - drivers, baffle/enclosure and such?
Attachments
2.0.76.5 (2021-09-12)
Main
* Ref angle stepping improved with '0 deg' angle step setting in Options.
* Preference rating with three decimals.
That is wrong/old. Interpretation is based on preliminary revision of CEA-2034-A. Final CTA-2034-A is clear for rear hemisphere. Just RMS / mean discussed earlier is not clear.
Main
* Ref angle stepping improved with '0 deg' angle step setting in Options.
* Preference rating with three decimals.
That is wrong/old. Interpretation is based on preliminary revision of CEA-2034-A. Final CTA-2034-A is clear for rear hemisphere. Just RMS / mean discussed earlier is not clear.
- Home
- Design & Build
- Software Tools
- VituixCAD