Insert "active gain/buffer" module before the passive way (the plain triangle symbol).

Member
Joined 2003
Just stopping in to say how much this software has changed my (audio) life. Absolutely wonderful, powerful and accurate. Love it.
^That is system problem with fonts. Application is using default font - typically Microsoft Sans Serif; 8.25pt. That works without problems all around the world, but I don't know are standard western fonts suitable for you.
I changed the language of the system and deleted VituixCAD. However, some settings have not been deleted. Can you tell me the folder where these files are saved? Then all the data can be deleted.
^I don't see any reason to uninstall or delete anything to change system language/font, but if you like to clean user settings they are located in hidden directory:
c:\Users\username\AppData\Local\Kimmo_Saunisto\VituixCAD2.exe_Url_...\version
so deleting all version folders below Kimmo_Saunisto\VituixCAD2.exe_Url_... will delete user settings of all versions - also in history.
c:\Users\username\AppData\Local\Kimmo_Saunisto\VituixCAD2.exe_Url_...\version
so deleting all version folders below Kimmo_Saunisto\VituixCAD2.exe_Url_... will delete user settings of all versions - also in history.
Last edited:
Hello
About Use Diffraction tool question
From YouTube video learning I can include woofer half space response file which produced in
Enclosure tool. But how can I produce my tweeter half space response file and impedance response file ? Normally tweeter did’t has as many as T/S parameters like woofer.
My tweeter has Re,fs,Qms,Qes but there is no Vas,Sd,Xmax
Member
Joined 2003
Just measure the tweeter far field on your intended baffle and you are done, no need to use diffraction tool.
Diffraction tool should really only be used to fill in low frequency information when measuring indoors, so not needed for tweeters.
Diffraction tool should really only be used to fill in low frequency information when measuring indoors, so not needed for tweeters.
Member
Joined 2003
Also, T/S is irrelevant for a tweeter, they come in a chamber already. Only frequency response on the baffle and impedance is needed.
Is it possible to export from Enclosure tool cone SPL, vent SPL and total SPL separately?
I found the export six-pack function and want to import this into REW as target, but do not know how to transform data accordingly.
I found the export six-pack function and want to import this into REW as target, but do not know how to transform data accordingly.
Last edited:
Hi Kimmosto! As always, thank you for your constant updates to think amazing piece of software.
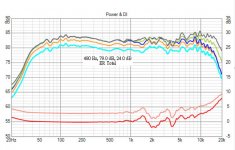
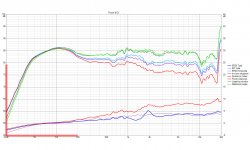
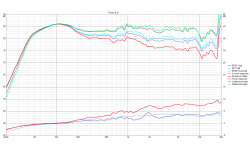
One issue I've noticed is with scaling of frequency response graphs. The CTA-2034A standard is 25 dB/decade (the actual document says 50dB/decade lol but it's a typo because the images are clearly 25/dB lol).
But with 25 dB/decade set in VCAD, the aspect ratio does not look correct. I've attached an image comparing the 25dB/decade setting in VCAD vs REW to show what I mean.
The red line represents the length of one decade. In VCAD it ends up being more like 29 dB/decade, and therefore much 'shorter' than in REW. The latter matches other sources with 25/dB decade measurements.
Changing the decade setting in 'Options' seems to change the whitespace around the image, but not the aspect ratio of the graph itself.
Thanks!
Attachments
Last edited:
One issue I've noticed is with scaling of frequency response graphs
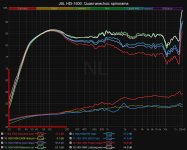
dB/decade setting is just temporary helper function for calculation of image size by frequency limits and SPL span. It is not continuous function so setting gives correct aspect ratio as long as you copy or export chart image with the same frequency limits and SPL span settings accepted in Options window.
For example 25 dB/dec
Attachments

Is it possible to export from Enclosure tool cone SPL, vent SPL and total SPL separately?
Export six-pack data contains cone and vent SPL magnitude, but not phase angle. If plain magnitude response is adequate, you need Excel or compatible to remove other than frequency and magnitude columns. Minimum phase extraction in Calculator can derive phase if needed somewhere.
Also, T/S is irrelevant for a tweeter, they come in a chamber already. Only frequency response on the baffle and impedance is needed.
OK, that means I need get measure gear first. Appreciated your input.
dB/decade setting is just temporary helper function for calculation of image size by frequency limits and SPL span. It is not continuous function so setting gives correct aspect ratio as long as you copy or export chart image with the same frequency limits and SPL span settings accepted in Options window.
For example 25 dB/dec
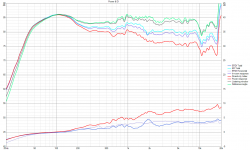
Thank you, I made sure all the settings were the same, but then I actually noticed what the issue was.
If I right-click on the image in the default 6-pack view, and export from there, the aspect ratio is correct. However if I double click on the image for the 'enlarged' preview, and then right-click to export, the aspect ratio is incorrect 🙂 Problem solved for me.
Attachments
if I double click on the image for the 'enlarged' preview, and then right-click to export, the aspect ratio is incorrect 🙂 Problem solved for me.
Sorry but I cannot repeat here on Windows 10. Aspect ratio stays correct in copied and exported image (via context menu) no matter is chart zoomed or not, or main window size adjusted or not - before or after zooming. Win 7 may have some differences also in this.
Strange! I just tried it again with a different project file and was able to replicate the issue once more. I am also on windows 10, on a Surface Book 3. I'll see if it happens on my other laptop tomorrow.
2.0.66.0 (2021-04-20)
Main, Optimize
* Added optimizing of predicted in-room response. Uses the same target curve with power response.
* 'Listening window average as axial response' checkbox changed to 'Listening window' radio button.
Main, Optimize
* Added optimizing of predicted in-room response. Uses the same target curve with power response.
* 'Listening window average as axial response' checkbox changed to 'Listening window' radio button.
on a Surface Book 3
Microsoft ... hmmmm 🙂
There is tiny possibility that feature which limits height of the chart while zoomed in interferes copy/export, but wrong operation would require that OS API reports size of 3x2 grid very wrong. Limiting feature is easy to switch off while copy/export so disturbance should be fixable no mater is it repeatable here or not.
- Home
- Design & Build
- Software Tools
- VituixCAD