Another fairly cheap way to dip a toe into the Sabre water is with the Khadas Tone Board, even cheaper than the D50, easy enough to fabricate a chassis if it's worthwhile, no more expensive than the Atom including free international shipping
Tone Board | Khadas
Reviewed on Audioscience
Review and Measurements of WesionTEK Khadas Tone Board DAC | Audio Science Review (ASR) Forum
Tone Board | Khadas
Reviewed on Audioscience
Review and Measurements of WesionTEK Khadas Tone Board DAC | Audio Science Review (ASR) Forum
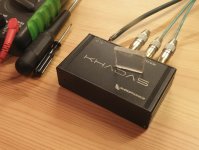
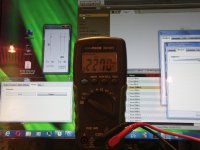
Agree there fluid, have KTB myself in active use for my head phone setup on a dedicated old notebook, in EU region one can get it at audiophonics in France including a relative low cost box as seen below, my box was their first batch so had to mod with a piece og acryl that the hole in box for LED light on PCB was bit relative offset, the other visual was a exercise for max output voltage @100Hz sinus from Jriver : ) KTB use the default LP filter 1 that reject about -80dB @22,05kHz, it can be upgraded with a ESS controller from IAN Canada so one can adjust those filters, but probably not worth it in value for me because subjective i sense this low cost DAC sounds as good as RME ADI-2 Pro fs.
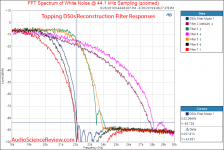
D50s filters is benched below from over ASR site and manuals naming for filters is:
Filter 1: Apodizing fast roll-off
Filter 2: Minimum phase slow roll-off
Filter 3: Minimum phase fast roll-off
Filter 4: Linear phase slow roll-off
Filter 5: Linear phase fast roll-off
Filter 6: Brick wall
Filter 7: Corrected minimum phase fast roll-off
Attachments
Last edited:
Hi all,
Happy to report i found the solution to the difficulty I was having with REW making simple accurate electrical summation measurements.
Since it also illustrates the efficacy of Wesayso's excellent 1/3 octave bandwidth filtered alignment technique, thought I'd post the solution and saga....
First, the problem I was having...
Pls note the 'Responsalyzer' in the 2-way xover test bed below.
The Responsalyzer is a dual channel FFT that can be placed and hooked up anywhere in the QSYS design.
In this case it is simply comparing the full range input signal to that signal low passed by a LR4 at 8kHz.
There is 0 latency or delay, and mag looks right; and phase properly shows 360 degrees rotation around going vertical at 8kHz.
(The Delay Matrix Mixers button in order are: high passed output, low passed output, and a straight line thru (becomes important later))

Using REW to measure the output of this test bed, I found there was literally nothing I could do in in terms of using loopback with or without any timing offsets indicated, or acoustic timing, or using 'no timing reference' with any of its options, or shifting impulse via estimated IR shift or using the All SPL aligment options.....
to get phase to go vertical at 8kHz....which equals correct measurement timing.
Here's some of the auto-type results which all varied a bit...and none were close to 8kHz.

The patterns of phase variance at 8kHz flip-flopped when measuring low-pass vs high-pass, and got even harder make sense of when moving xover freq around.
Something led me to start running REW against the summed low-pass and high-pass channels, and I got lucky and noticed that 'Delay relative to loopback' varied a little by xover frequency.
I'm like wtf? Shouldn't loopback time of the full-range summed IIR signal just be the processor's fixed latency?
So i add a straight input-to-output (#3 on Mixer) to nail down processor latency...
Lo and behold, Mark learns, it's lower than when the xover is in play, even when both sides of the xover are summed.
But not always, processor latency was identical to the summed xover delay once xover frequency went below about 1kHz.
And I also learn if i put the processor latency in as the Timing Offset for Loopback, phase traces go vertical right on xover freq like they should, for both hp and lp, and at any xover frequency.
And mag summation in REW is perfect 😀
Everything looks just like the Responsalyzer.
At 8kHz the extra Delay vs Loopback (with processor latency offset in place) is 0.051ms. This number fades down to zero at about 1kHz, and gets larger as xover moves above 8k.
My theory is the higher the xover freq, the more of the freq spectrum that lies under the 360 degrees of phase rotation.
And the 0.051ms for example represents the integral of that rotation across the full range signal at 8k and fades to zero as freq decreases.
So once below a certain freq, phase rotation becomes too insignificant to show up as Delay in the summed signal.
If any body is still following along..would love your thoughts here...
Ok back to Wesayso's 1/3 octave impulse technique...
Using nothing more complicated than Loopack offset by processor latency (my sincere apologies for ranting, REW)
here are 1/3 impulse alignments without any time adjustment for 8kHz first, and 100 Hz next.


My take is that when looking at 1/3 filtered impulses right at xover frequency, both peaks and starts align.
That's of course in contrast to unfiltered impulses where only starts align. (IIR)
8kHz, then 100Hz


Hope that all made sense...🙂
Happy to report i found the solution to the difficulty I was having with REW making simple accurate electrical summation measurements.
Since it also illustrates the efficacy of Wesayso's excellent 1/3 octave bandwidth filtered alignment technique, thought I'd post the solution and saga....
First, the problem I was having...
Pls note the 'Responsalyzer' in the 2-way xover test bed below.
The Responsalyzer is a dual channel FFT that can be placed and hooked up anywhere in the QSYS design.
In this case it is simply comparing the full range input signal to that signal low passed by a LR4 at 8kHz.
There is 0 latency or delay, and mag looks right; and phase properly shows 360 degrees rotation around going vertical at 8kHz.
(The Delay Matrix Mixers button in order are: high passed output, low passed output, and a straight line thru (becomes important later))
Using REW to measure the output of this test bed, I found there was literally nothing I could do in in terms of using loopback with or without any timing offsets indicated, or acoustic timing, or using 'no timing reference' with any of its options, or shifting impulse via estimated IR shift or using the All SPL aligment options.....
to get phase to go vertical at 8kHz....which equals correct measurement timing.
Here's some of the auto-type results which all varied a bit...and none were close to 8kHz.
The patterns of phase variance at 8kHz flip-flopped when measuring low-pass vs high-pass, and got even harder make sense of when moving xover freq around.
Something led me to start running REW against the summed low-pass and high-pass channels, and I got lucky and noticed that 'Delay relative to loopback' varied a little by xover frequency.
I'm like wtf? Shouldn't loopback time of the full-range summed IIR signal just be the processor's fixed latency?
So i add a straight input-to-output (#3 on Mixer) to nail down processor latency...
Lo and behold, Mark learns, it's lower than when the xover is in play, even when both sides of the xover are summed.
But not always, processor latency was identical to the summed xover delay once xover frequency went below about 1kHz.
And I also learn if i put the processor latency in as the Timing Offset for Loopback, phase traces go vertical right on xover freq like they should, for both hp and lp, and at any xover frequency.
And mag summation in REW is perfect 😀
Everything looks just like the Responsalyzer.
At 8kHz the extra Delay vs Loopback (with processor latency offset in place) is 0.051ms. This number fades down to zero at about 1kHz, and gets larger as xover moves above 8k.
My theory is the higher the xover freq, the more of the freq spectrum that lies under the 360 degrees of phase rotation.
And the 0.051ms for example represents the integral of that rotation across the full range signal at 8k and fades to zero as freq decreases.
So once below a certain freq, phase rotation becomes too insignificant to show up as Delay in the summed signal.
If any body is still following along..would love your thoughts here...
Ok back to Wesayso's 1/3 octave impulse technique...
Using nothing more complicated than Loopack offset by processor latency (my sincere apologies for ranting, REW)
here are 1/3 impulse alignments without any time adjustment for 8kHz first, and 100 Hz next.
My take is that when looking at 1/3 filtered impulses right at xover frequency, both peaks and starts align.
That's of course in contrast to unfiltered impulses where only starts align. (IIR)
8kHz, then 100Hz
Hope that all made sense...🙂
Well I'm sure you will get a 32 bit DAC one of these days. In the meantime I reread the M1 DAC review and saw its noise floor was a very respectable -130db.
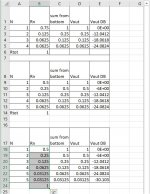
Triggered by this I had some fun this morning developing a 6 db step attenuator spreadsheet. I did the first one the hard way - by writing and solving the set of voltage divider equations for reach resistor. Then I saw the pattern - the spreadsheet can be extended downwards to any number of taps by splitting the lowest resistor in half to add an additional higher attenuation step. And of course I could have started with a different step size and ended up with a fine step attenuator.
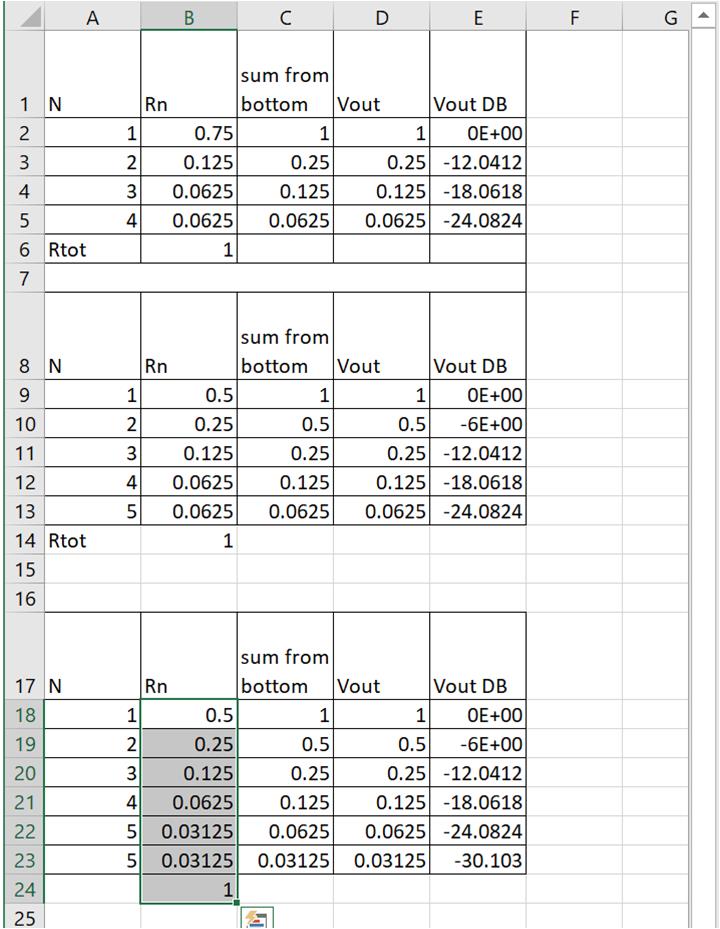
That doesn't mean it doesn't get complicated incorporating 6 channels in a system. When you consider all of those complications, the 8 channel analog volume control chip CS3318 with 127 db dynamic range starts looking pretty good.
$25 each at digikey
Triggered by this I had some fun this morning developing a 6 db step attenuator spreadsheet. I did the first one the hard way - by writing and solving the set of voltage divider equations for reach resistor. Then I saw the pattern - the spreadsheet can be extended downwards to any number of taps by splitting the lowest resistor in half to add an additional higher attenuation step. And of course I could have started with a different step size and ended up with a fine step attenuator.
That doesn't mean it doesn't get complicated incorporating 6 channels in a system. When you consider all of those complications, the 8 channel analog volume control chip CS3318 with 127 db dynamic range starts looking pretty good.
$25 each at digikey
Attachments
Last edited:
Mark, glad to read you've got it figured out. Not behind a pc right now, I'll look at it all a bit later on. Sure glad to see my proposal working as planned 🙂. Good to see confirmation for that, it's an excellent visual helper tool.
Great Ron, thx!
Your technique is spot on i think.
The whole exercise of running my phase problem down has been a big learning experience.
I've begun to realize how the FFT process has to discern how to breakdown the total loopback time into a fixed-time latency component (time of flight or excess delay)
and a fine tuning component dependent on the degree of calculated phase rotation....even when the signal is full range.
It's been a big breakthru for me in seeing the full range aspect.. thx for hangin in 🙂
Would it be a wild idea to ask for a feature in REW that lets us choose a frequency for applying a 1/3 oct. filter? That should help out in getting the crossover right for lots of people.
Would it be a wild idea to ask for a feature in REW that lets us choose a frequency for applying a 1/3 oct. filter? That should help out in getting the crossover right for lots of people.
I don't know what to think yet really.
Part of me wants to say yes, that could really help if there was a way to display two 1/3 oct filter traces, and have a time offset adjustment on one to bring them both inline.
Another part of me says I'd really rather just have phase traces automatically generated on measurement, that I can understand and trust.
Maybe that just means I need to better understand the measurement timing options. I dunno.
Anyway, my eyes have been opened quite a bit as to what phase rotation means to measurement timings, even on a full range signal.
I need to think some more.....
(A third part of me says 'am I crazy for even wasting time sorting out IIR and phase rotation' ??? I think so!!! Lol )
Oh, one more experiment I ran....
I used 90Hz and 7000Hz xover points with LR4s as before, chosen because they are in-between 1/3 octave filter frequencies.
Then i applied 80Hz and 100Hz 1/3 impulse filters to the 90Hz set. And 6300Hz and 8000Hz 1/3 impulse filters to the 7000Hz set.
Every one of those 4 sets of overlays looked spot on...there's apparently no need for exact frequency matching of xover frequency with 1/3 octave filters.
Minimum phase slopes there 🙂 for linear phase slopes its peaks not starts, right 🙂
Hi ByRTT, appears I agreed with you too quickly on a followup post, that linear phase peaks are the correct alignment....
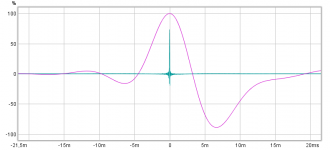
Look at the impulse peak offset for 100Hz linear phase low-pass and high-pass. (They summed perfectly mag and phase, of course)

At least the good ole 1/3 oct impulse holds true 🙂

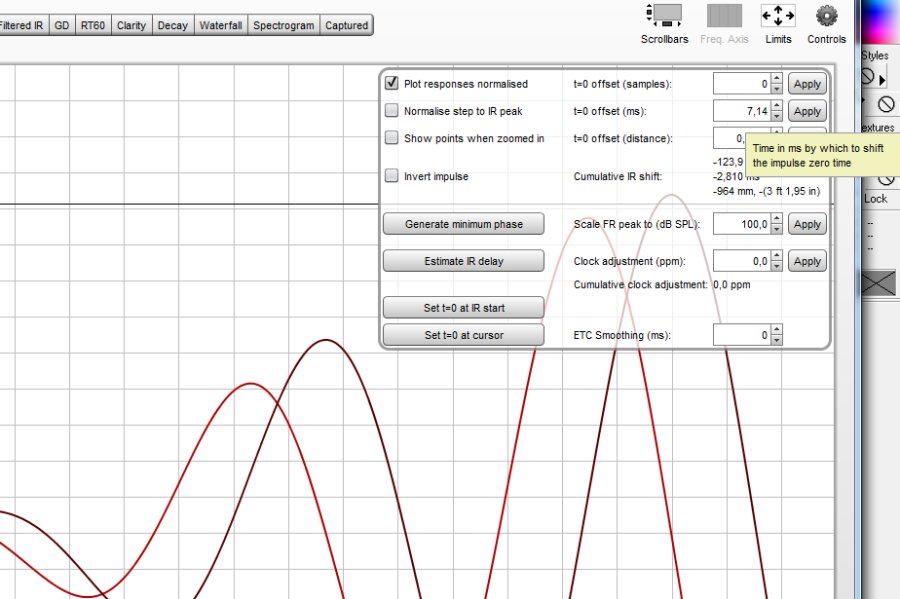
Here we advance the sub by the 7.14 ms difference we found in the overlays.
from post#5819: Can you please advise where is this done in REW? Struggling to find. Or maybe post a full screenshot showing all tabs... Thanks
Hi ByRTT, appears I agreed with you too quickly on a followup post, that linear phase peaks are the correct alignment....
Look at the impulse peak offset for 100Hz linear phase low-pass and high-pass. (They summed perfectly mag and phase, of course)...
At least the good ole 1/3 oct impulse holds true 🙂...
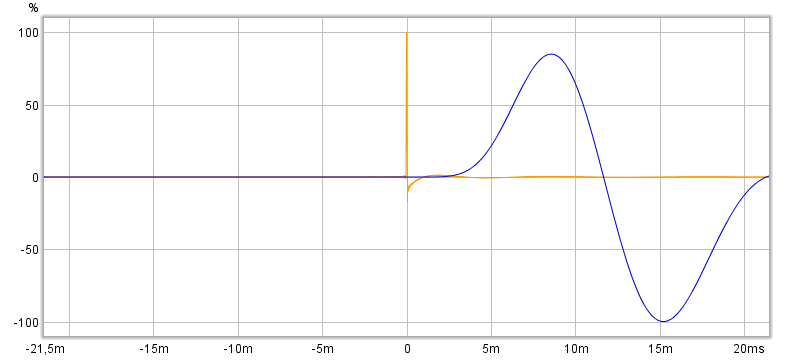
Hi mark100, above claims have my protest, dont say or claim i'm any better this stuff than you or anybody else 🙂 but it worry me a bit you get this result then later you get that result, all these this and that should start a flame than one need check up on stuff from books or textbook examples and find out where in chain the stuff goes wrong make filters real world. I can't know reasons for variations but suggest analyze your settings in REW how it allign IR from sweep to sweep and does it have a reference signal from the other channel or a acoustic reference so it can compute precise propagation delay and time of flight etc. Tip when you create texbook IR examples in Rephase there a dialog below "Generate" button that in numbers tells exactly where IR is situated down the time line and can be used as quality check or re allignment how the imported IR looks over in REW.
Below is textbook example of LP verse MP LR8 @100Hz where system stopbands is set to cut at 20Hz and 20kHz BW2, why your own LP example end line up perfect with a non symetric offset IR could be above worry of your REW time reference setting or that the two passband you try sum is really not covering the correct target bandwidth or include false room gain reflections or what do i know 🙂 well i know in real world sounds we have MP domain behavour and in a compete on a race track per one cycle a higher frq note will always win over a lower frq note but also the lower frq note will have to travel much longer distance, and that behavour think is inline with below examples and think one has to be carefull and always rethink when one use FIR filters to massage the acoustic domain.
LP IR allignment:
MP IR allignment:
Attachments

Last edited:
from post#5819: Can you please advise where is this done in REW? Struggling to find. Or maybe post a full screenshot showing all tabs... Thanks
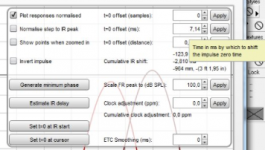
That was taken from the regular IR tab (Next to Filtered IR), then click on Controls (upper right corner). That should give you this dialog box where you can shift IR traces.
However in real live one would use DSP or physically move one of the drivers to realize that delay. This was a mere demonstration of the usefulness of filtered IR's.
Hi ByRTT, appears I agreed with you too quickly on a followup post, that linear phase peaks are the correct alignment....
Look at the impulse peak offset for 100Hz linear phase low-pass and high-pass. (They summed perfectly mag and phase, of course)
View attachment 824197
At least the good ole 1/3 oct impulse holds true 🙂
View attachment 824198
So the 1/3 octave view is pretty solid, right? As I said it would be for all crossover types we normally use. Which is why I think it would rock if we could actually set that frequency as a 1/3 octave filter right where we want to cross over.
That was taken from the regular IR tab (Next to Filtered IR), then click on Controls (upper right corner). That should give you this dialog box where you can shift IR traces.
However in real live one would use DSP or physically move one of the drivers to realize that delay. This was a mere demonstration of the usefulness of filtered IR's.
The IR (Impulse) tab > Controls on my REW (V5.20.Beta 41) displays different dialog box, therefore my question.
Attachments

Hi mark100, above claims have my protest, dont say or claim i'm any better this stuff than you or anybody else 🙂 but it worry me a bit you get this result then later you get that result, all these this and that should start a flame than one need check up on stuff from books or textbook examples and find out where in chain the stuff goes wrong make filters real world. I can't know reasons for variations but suggest analyze your settings in REW how it allign IR from sweep to sweep and does it have a reference signal from the other channel or a acoustic reference so it can compute precise propagation delay and time of flight etc. Tip when you create texbook IR examples in Rephase there a dialog below "Generate" button that in numbers tells exactly where IR is situated down the time line and can be used as quality check or re allignment how the imported IR looks over in REW.
Below is textbook example of LP verse MP LR8 @100Hz where system stopbands is set to cut at 20Hz and 20kHz BW2, why your own LP example end line up perfect with a non symetric offset IR could be above worry of your REW time reference setting or that the two passband you try sum is really not covering the correct target bandwidth or include false room gain reflections or what do i know 🙂 well i know in real world sounds we have MP domain behavour and in a compete on a race track per one cycle a higher frq note will always win over a lower frq note but also the lower frq note will have to travel much longer distance, and that behavour think is inline with below examples and think one has to be carefull and always rethink when one use FIR filters to massage the acoustic domain.
LP IR allignment:

MP IR allignment:
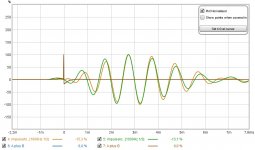
I keep getting that imported impulses from rePhase traces do not match actual measurements, comparing the same passband setups.
100Hz LR8 linear phase imports on left side
100Hz (40/dB oct) linear phase electrical measurements on right side
Theory is fine for imports, but when REW has to make its own impulse file via a sine sweep, it appears things change....
btw, how do you embed larger images like in your post?

So the 1/3 octave view is pretty solid, right? As I said it would be for all crossover types we normally use. Which is why I think it would rock if we could actually set that frequency as a 1/3 octave filter right where we want to cross over.
Yes, pretty solid !
Did you catch the point of the 90Hz, and 7kHz xover tests, where 1/3 octave filters didn't line up?
It doesn't appear that we need to be able to match 1/3 filtering centers with exact crossover freqs.
Yes, pretty solid !
Did you catch the point of the 90Hz, and 7kHz xover tests, where 1/3 octave filters didn't line up?
It doesn't appear that we need to be able to match 1/3 filtering centers with exact crossover freqs.
You mean this post earlier:
Oh, one more experiment I ran....
I used 90Hz and 7000Hz xover points with LR4s as before, chosen because they are in-between 1/3 octave filter frequencies.
Then i applied 80Hz and 100Hz 1/3 impulse filters to the 90Hz set. And 6300Hz and 8000Hz 1/3 impulse filters to the 7000Hz set.
Every one of those 4 sets of overlays looked spot on...there's apparently no need for exact frequency matching of xover frequency with 1/3 octave filters.
With the Linkwitz Riley crossover we have wide phase overlap between both drivers. So we can actually set it a bit off the crossover and still have it match in the filtered results.
However if we use asymmetrical filters the overlap might be too small to use it. We could align those traces at the crossover even with such a crossover if we can use the 1/3 filter there.
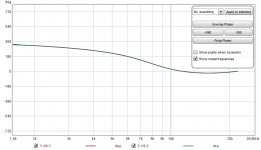
Phase trace of the Linkwitz Riley crossover:
With a Dirac pulse example the phase traces as seen in the Overlay window will be exactly on to of each other. However in our real world, things will not be this simple all of the time. Phase here is unwrapped to see it's full movement instead of the wraps at 180 degree.
Attachments
I think you are being modest, you have as good a grasp of this as anyone posting if not more so 😉Hi mark100, above claims have my protest, dont say or claim i'm any better this stuff than you or anybody else 🙂
It looks to me that the filtered view being inline does not result in the peaks being aligned in your previous images. The scales are different but the peaks are not aligned like Byrtt's images.I keep getting that imported impulses from rePhase traces do not match actual measurements, comparing the same passband setups.
100Hz LR8 linear phase imports on left side
100Hz (40/dB oct) linear phase electrical measurements on right side
Theory is fine for imports, but when REW has to make its own impulse file via a sine sweep, it appears things change....
btw, how do you embed larger images like in your post?
Without a proper time locked measurement it is unlikely to work right every time. There can be many propagation delays in an audio system every time something is processed. These are not always stable either. When you tried a plain TC9 by itself without processing it all worked so I would be looking at your hardware processor to eliminate that as a variable.
Are you using a USB Mic or an analogue mic into an interface?
If it is USB an acoustic timing reference should help, if it is analogue then a loopback timing reference is even better. The loopback timing is like what ARTA does in dual channel mode comparing the input to the reference signal.
Kimmo has a good write up on how to take measurements to work with VituixCAD. This is the first thing that is mentioned because without time locked measurements nothing else will work.
As to embedding larger images, upload them to the the forum, then in the Additional options, attach files below the main reply page you should see your attached images, right click and choose save target link as (or something like that)
Use the insert image option (landscape picture) and paste the link in, preview it and you should have the image. Just make sure it is not too big or it will swamp people's screens.
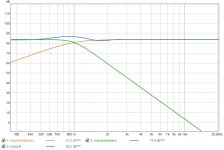
For instance it should be usable on a Harsch type crossover too:


Not a standard type of crossover, put pretty hard to get right conventionally.
It sums +3 dB around the crossover point but has excellent group delay without being a linear phase variant. It's all minimum phase.
More here: S. Harsch XO
Not a standard type of crossover, put pretty hard to get right conventionally.
It sums +3 dB around the crossover point but has excellent group delay without being a linear phase variant. It's all minimum phase.
More here: S. Harsch XO
Attachments
The IR (Impulse) tab > Controls on my REW (V5.20.Beta 41) displays different dialog box, therefore my question.
I still have beta 22 installed, that might explain the differences. However it would be a shame to lose the option of fine tuning impulse responses. I've used it often to try some theories (like these Filtered responses).
Doesn't pressing that offset button lead to a setting box of its own? Where we can shift an IR by entering numbers?
I would expect it to do that, as can be read in the old manual: Impulse Graph
Can't think of a single reason to edit out that useful option. 😱
Last edited:
- Home
- Loudspeakers
- Full Range
- The making of: The Two Towers (a 25 driver Full Range line array)