I would, if nothing else, recommend adopting Mark's suggestion of changing LED1 to a LTLCR5800 thereby making current limiting resistor another tool for control over timing...
Actually, what I suggested (in THIS post) is "an LED rated for 50mA". There are several to choose from.
This one from Avago, for example, is sold in a surface mount package.
Fans of kludges, bodges, ghetto-mods, and shiteRiggs, may prefer to simply solder two standard LEDs to the board, in parallel. Perhaps both on the component side, or one on either side, whatever pleases you. It's not optimal but it certainly is possible -- and you can do it right now, without ordering any new partnumbers. The only goal is to permit higher-than-25mA currents to flow in the current limiting resistor, without burning anything up. Feel free to indulge your OCPD if necessary, and hand-select a matched pair of LEDs after much measuring.
You haven't really tested your softstart circuit until you've switched it on at every possible phase angle of the mains sinewave. Surprisingly (?), some phase angles are worse, much worse, than others. Those are the phase angles at which your customers will switch-on their equipment, thereby popping the fuse, burning the transformer, etc. By Murphy's Law.
90 or 270 degree phase. And I assume one should assume the upper range of mains voltage.
(The change in phase assumption also wreaks havoc on speed of simulations.)
90 or 270 degree phase.
surge current is minimal here, be wary of the 0, 180 degrees, that is where the surge current is highest...Inrush current - Wikipedia, the free encyclopedia
Hmm. If you integrate the waveform running through the resistor bank or NTC while merely changing the initial phase of the mains supply (i.e. leaving all else constant) the current through the protection mechanism is greatest at 90/270 phase. I will take a closer look.
Last edited:
When I run my model of the store's soft start circuit with the upper bound of the UK voltage range (358 peak) I get the following:
0 degree starting phase
First second RMS current through each soft start resistor: 383mA
Power dissipated by each resistor: 26.4J
Relay trips at circa 285ms
First second RMS current through the normally open relay pin: 1.9A
90 degree starting phase
First second RMS current through each soft start resistor: 561mA
Power dissipated by each resistor: 56.6J
Relay trips at circa 277ms
First second RMS current through the normally open relay pin: 3.5A
Note that the soft start resistors, all else being equal (no component changes), have to dissipate more than twice the energy in the 90 degree scenario.
Shifting the starting phase to 90 degrees does all sorts of ugly things to an NTC-based soft start relative to a starting phase of 0 degrees.
I do have a question regarding modelling transformers for which data sheet information is at best scarce. Even sticking with ideal transformers (i.e. not attempting to model characteristics such as leakage inductance), one can perhaps pester a supplier for approximate primary and secondary resistance values but what about inductance? The turns ratio gives the relative inductance ratio but what of the absolute level of either primary or secondary inductance? I've never seen figures in a data sheet and when I asked one producer for resistance and inductance figures they supplied the former and never the later.
Morgan Jones wrote an article in Linear Audio v.5 called "Rectifier Snubbing - Background and Best Practices". In the article he advocated plotting impedance versus frequency, as a way to measure transformer leakage inductance, capacitance, magnetizing inductance, core losses, etc.
Jones used a HAMEG model 8118 LCR bridge ($2300) to measure some of his data, and measured the rest by hand using a sinewave generator, a resistor, and a dual channel oscilloscope. It's actually a fairly simple setup: you build a voltage divider: top arm is a fixed resistor of known value, bottom arm is Impedance_Under_Test. You apply a sinewave of known frequency across both. Use scope channel#1 to measure V_across_both, use channel#2 to measure V_across_Impedance_Under_Test. Record both in a spreadsheet. Then have the spreadsheet calculate the voltage divider mathematics that computes the impedance of the bottom leg, given the impedance of the top leg and the voltage ratio.
If your scope is digital, it'll measure these two voltages for you and display the values right on the face. ProTip: run the horizontal sweep slowly, slow enough that you get ten or more periods on the scope face, and set the scope measurement functions to display RMS voltage. This will give it enough data to average out noise, and to average out any errors cause by having a non-integer number of periods in the calculation.
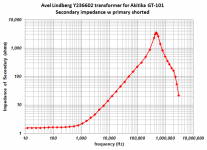
I did all of the above, myself, on my kitchen table. I got plots whose shape resembled those in Morgan Jones's article. Some of my measured data is displayed below.
Jones's idea is to model the various segments of the plot, with resistors, capacitors, and inductors. For example the flat zone over on the far left, is modeled as a resistor whose value is 1.5 ohms. Beware: the secondary DC resistance (measured with an ohmmeter) of this transformer, was less than 0.5 ohms. The flat zone in impedance-versus-frequency, is a combination of DC resistance plus other low frequency losses (in the core). So the 1.5 ohm resistor in the equivalent circuit model, handles both.
You could make these same kinds of measurements yourself, if you really wanted to. All you need is a sinewave generator, a two channel oscilloscope, and patience. Your measured plots let you extract magnetizing inductance, leakage inductance, low frequency equivalent-resistive losses, etc. Homework problems on the attached measurements below: (HW1): Which segment of the plot should be used to extract secondary inductance {between frequency X and frequency Y, for which values of X and Y}?? (HW2): From the plot, what is the secondary leakage inductance in Henrys, approximately?
_
Jones used a HAMEG model 8118 LCR bridge ($2300) to measure some of his data, and measured the rest by hand using a sinewave generator, a resistor, and a dual channel oscilloscope. It's actually a fairly simple setup: you build a voltage divider: top arm is a fixed resistor of known value, bottom arm is Impedance_Under_Test. You apply a sinewave of known frequency across both. Use scope channel#1 to measure V_across_both, use channel#2 to measure V_across_Impedance_Under_Test. Record both in a spreadsheet. Then have the spreadsheet calculate the voltage divider mathematics that computes the impedance of the bottom leg, given the impedance of the top leg and the voltage ratio.
If your scope is digital, it'll measure these two voltages for you and display the values right on the face. ProTip: run the horizontal sweep slowly, slow enough that you get ten or more periods on the scope face, and set the scope measurement functions to display RMS voltage. This will give it enough data to average out noise, and to average out any errors cause by having a non-integer number of periods in the calculation.
I did all of the above, myself, on my kitchen table. I got plots whose shape resembled those in Morgan Jones's article. Some of my measured data is displayed below.
Jones's idea is to model the various segments of the plot, with resistors, capacitors, and inductors. For example the flat zone over on the far left, is modeled as a resistor whose value is 1.5 ohms. Beware: the secondary DC resistance (measured with an ohmmeter) of this transformer, was less than 0.5 ohms. The flat zone in impedance-versus-frequency, is a combination of DC resistance plus other low frequency losses (in the core). So the 1.5 ohm resistor in the equivalent circuit model, handles both.
You could make these same kinds of measurements yourself, if you really wanted to. All you need is a sinewave generator, a two channel oscilloscope, and patience. Your measured plots let you extract magnetizing inductance, leakage inductance, low frequency equivalent-resistive losses, etc. Homework problems on the attached measurements below: (HW1): Which segment of the plot should be used to extract secondary inductance {between frequency X and frequency Y, for which values of X and Y}?? (HW2): From the plot, what is the secondary leakage inductance in Henrys, approximately?
_
Attachments
HW1: in your case, c60Hz
HW2: XL = 2PifL if we read XL to be circa 1.5R then circa 4mH but am uncertain as to whether this is secondary inductance (= secondary self-inductance) or secondary leakage inductance and which figure is demanded by LTspice*.
EDIT: * I understand LTspice calculates leakages based on the mutual coupling coefficient k
(Unfortunately I do not have a signal generator.)
Last edited:
Regrettably, wrong and wrong.HW1: in your case, c60Hz
HW2: XL = 2PifL if we read XL to be circa 1.5R then circa 4mH
Find the zone in which the plotted data behaves like an ideal inductor would behave. Then calculate: what ideal inductor value would have impedance vs freq which matches the measured data in that zone.
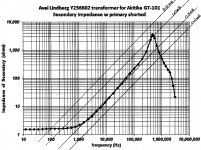
Or, if you seek an approach which replaces thinking with doing, plot the impedance-vs-frequency curves of several different ideal inductors (0.1mH, 0.3mH, 1.0mH, 3.0mH) on the same graph as the transformer measurements. Which ideal inductor's impedance_vs_frequency curve, most closely approximates the measured data? Do this again at finer granularity, i.e., zoom in. After a couple of iterations you'll have a best-fit-within-10% ideal inductor value. And you never had to think; merely plot.
The way to deduce this is a measurement of secondary leakage inductance, is to read the plot title. It says the primary is shorted. This removes the secondary magnetizing inductance, leaving only the secondary leakage inductance to be measured.
By the way, I used (this) function generator to perform my measurements (but I bought it for a better price at a non-Amazon shop). Digital frequency readout made it simple to set the test frequency precisely AND quickly; I chose frequencies from the E6 series (like resistor values: 10, 15, 22, etc), giving equally spaced datapoints on a log frequency axis. Why do the measurements stop at 3 megahertz? Cause that's where my sinewave generator tops out.
Last edited:
ok I should have looked at the peak in impedance. Let's call it 3.5k @ 450k Hz. Again using the formula above, circa 1.2mH.
At frequency f Hertz, an ideal inductor's impedance X_sub_L is given by
As frequency rises, so does the inductor's impedance. At infinite frequency, the inductor's impedance is infinity ("it's an open circuit at high frequencies"). At zero frequency, the inductor's impedance is zero ("it's a short circuit at DC").
In particular, for every 10X increase in frequency, the inductance increases 10X. When we plot inductor impedance vs frequency on log log axes, we see that impedance rises one decade, for every decade increase in frequency.
Take at a look at the attached plot. It performs the all-perspiration, no-inspiration activity suggested in (this post). Notice how the ideal inductors' impedances rise with rising frequency, at one decade per decade.
- X_sub_L = 2 * pi * f * L
As frequency rises, so does the inductor's impedance. At infinite frequency, the inductor's impedance is infinity ("it's an open circuit at high frequencies"). At zero frequency, the inductor's impedance is zero ("it's a short circuit at DC").
In particular, for every 10X increase in frequency, the inductance increases 10X. When we plot inductor impedance vs frequency on log log axes, we see that impedance rises one decade, for every decade increase in frequency.
Take at a look at the attached plot. It performs the all-perspiration, no-inspiration activity suggested in (this post). Notice how the ideal inductors' impedances rise with rising frequency, at one decade per decade.
Attachments
Now you possess one method of measuring inductance, using a sinewave generator, a fixed resistor of known value, and a two channel oscilloscope.... one can perhaps pester a supplier for approximate primary and secondary resistance values but what about inductance? ... the absolute level of either primary or secondary inductance? I've never seen figures in a data sheet and when I asked one producer for resistance and inductance figures they supplied the former and never the later.
If you want to measure primary total inductance (Lmagnetizing + Lleakage), treat the two ends of the primary winding as the two terminals of an inductor, and leave all other windings open-circuit. Measure impedance vs frequency and fit an inductance to the data by the method of ignorantly-plotting-many-straight-lines-then-picking-the-nearest.
If you want to measure secondary total inductance (Lmagnetizing + Lleakage), treat the two ends of the secondary as the terminals of an inductor. Leave all other windings open-circuit. Measure Z_vs_f and fit an inductance to the data.
You will find that the DC resistance (measured with an ohmmeter) is never equal to the low frequency impedance. Why? Because Z_total = R_dc + Core_Loss_Mechanisms. And there are core loss mechanisms, even at low frequencies.
Thanks a lot Mark. I now need to look more closely at modelling imperfect transformers in LTspice. Hopefully this discussion is useful to others as well.
Today I'm rather baffled by phase and it's impact on the current waveforms for the soft start board models I did. BTW I have updated these to be able to model any NTC in-rush current limiter rather than just selecting from the EPCOS models which are rather restrictive in terms of specs. One just needs to enter the parameters for the NTC in question (nominal R, dissipation constant, thermal time constant etc).
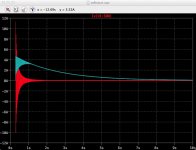
Softstart.asc models the board as configured (i.e. 4 x 180R resistors, no hysteresis etc) for peak UK voltage. It's interesting to look at the current waveforms through the resistors and through the relay bypass while varying the starting phase. Below is a graphic of the latter over 10 seconds - red is with 0 degree starting phase and turquoise is with 90 degree starting phase.
I was expecting them to be of relatively similar 'form' albeit of different amplitude and 'duration'. They're extremely different in shape. They integrate to very different numbers: 372mA for 0 starting phase and 1.57A for 90 degree starting phase. Integrating their power cousins yields very different joules: 3.78J for 0 degrees and 6.3 for 90 degrees. Looking at the waveform through the 4 resistors also shows very different results: 420.7mA / 161.9J for zero degrees and 711.8mA / 201.6J for 90 degrees. While of course one wouldn't expect each scenario to total to exactly the same joules (more energy is burnt off in the resistor bank than in the other) I did not expect them to be so different.
Something screwy with the model or readily explained?
Today I'm rather baffled by phase and it's impact on the current waveforms for the soft start board models I did. BTW I have updated these to be able to model any NTC in-rush current limiter rather than just selecting from the EPCOS models which are rather restrictive in terms of specs. One just needs to enter the parameters for the NTC in question (nominal R, dissipation constant, thermal time constant etc).
Softstart.asc models the board as configured (i.e. 4 x 180R resistors, no hysteresis etc) for peak UK voltage. It's interesting to look at the current waveforms through the resistors and through the relay bypass while varying the starting phase. Below is a graphic of the latter over 10 seconds - red is with 0 degree starting phase and turquoise is with 90 degree starting phase.
I was expecting them to be of relatively similar 'form' albeit of different amplitude and 'duration'. They're extremely different in shape. They integrate to very different numbers: 372mA for 0 starting phase and 1.57A for 90 degree starting phase. Integrating their power cousins yields very different joules: 3.78J for 0 degrees and 6.3 for 90 degrees. Looking at the waveform through the 4 resistors also shows very different results: 420.7mA / 161.9J for zero degrees and 711.8mA / 201.6J for 90 degrees. While of course one wouldn't expect each scenario to total to exactly the same joules (more energy is burnt off in the resistor bank than in the other) I did not expect them to be so different.
Something screwy with the model or readily explained?
Attachments
I'll bet that you didn't include the ON/OFF switch, which applies mains power to the transformer + softstart board.
I'll bet that, instead, you just applied a phase shifted sine wave "because it was easier."
I'll bet that your simulation shows DC flowing in the transformer primary at time=0, and I'll bet this DC current is equal to VmainsPeak / (Rsoftstart + Rprimary) , more or less.
It is not a good idea to squirt DC thru the primary of a transformer.
If you do have a switch in your simulation, I'll bet it isn't working properly. If you don't have one, then you just squandered one of your precious "please help me diyAudio" wishes, on a very clumsy blunder. Either put the switch in the simulation, or else figure out an appropriate set of LTSPICE ".IC" directives (IC = Initial Condition) which guarantee that all primary current pathways have zero microamps flowing thru them, before "switch on". Then figure out how to do this for varying phase angles.
🙂 No switch and, yes, a phase shifted sine wave, but not because I thought it was easier; rather merely because I was thinking at time=0 all could be immediately 'switched on/connected' to such voltage source (in real life just remove the chassis power switch and have no mains plug receptacle switch and there you are) with the starting phase of the voltage source being wherever it lies and so I thought it not a bad assumption. Indeed, current at the primary at T=0 is non-zero, but if Phi is defined by LTspice merely as starting phase of a sine voltage source I'm not sure why that naturally leads to this result (and from there why a switch would remove the issue). I will explore more.
I have no way of testing for this condition.
It is reported by a few that the remaining flux in the core at switch OFF time affects the start up current draw.
This would create a random variation in start up behaviour. Some being worse and some being less stressing.
That combined with the phase of the mains at the moment of switch closing will result in a big variation of start up current.
I find that a resistor value using my simple arithmetic for Vpk and R gives a start up current that does not blow the close rated mains fuse.
240VA transformer on 240Vac mains requires a T1A fuse or a little bit less.
Using 1A as my guide, I design the start up current to be ~ double the fuse rating i.e. 2A The peak current will be nearer 3Apk.
This would need a total primary circuit resistance of ~120ohms.
Five or six 20r in series meets that.
I use five 20r for 100ohms of added start up resistance. T1A does not blow.
Last edited:
Unfortunately that's only half the problem. It answers question 1a, "How low can the series resistance be, and not blow the fuse?" But it doesn't answer question 1b, "How high can the series resistance be, and not blow the fuse?"... 240VA transformer on 240Vac mains requires a 1A fuse or a little bit less. ... I design the start up current to be ~ double the fuse rating i.e. 2A ... This would need a total primary circuit resistance of ~120ohms [240V/2A] ... I use five 20r for 100ohms of added start up resistance ... [the fuse] does not blow.
Another hobbyist might reason that they want the startup current to be ~ half the fuse rating i.e. 0.5A, resulting in a total primary circuit resistance of 480 ohms. Does the fuse blow in this example? You don't say. How about 960 ohms (0.25A)? There must exist a resistance value which is too high; infinity ohms, for example, does absolutely nothing during the "soft start" period and then slams a full "not softened start" transient when the relay closes. Question 1b remains unanswered: "How high can the series resistance be, and not blow the fuse?"
Once both questions are answered, a prudent and conservative person can select their total primary circuit resistance to be somewhere between R_low_and_okay & R_high_and_okay , thereby gaining peace of mind from having plenty of safety margin.
Last edited:
I have not looked seriously at the pulse as the bypass operates. I know there is an increase in current (and it can be a big increase) due to the transformer having already started and the beginning of the capacitor charging requiring substantial output from the transformer.
But I don't have problems with capacitor charging, so I have not gone into this part for a slow charging circuit.
Keeping that in mind as a problem that may need a solution, what about the method for getting a resistance to "start" the transformer?
Very many would say that 300VA does not need any soft start. My example of a 240VA soft start will probably have these non believers and a few more saying 100r of added resistance is already TOO HIGH.
Do you have any guidance on arriving at a "too high" added resistance?
I updated my models to include a power switch. I borrowed from BigE's work:
.model NO SW(Vt=4.8 Vh=3.6 Ron=.075)
and drove it with a pulsed voltage source, initial 0V stepping to 10V (10nS rise/fall) with no delay. Output for non-zero mains Phi now makes a lot more sense. (I'm still pondering the vagaries of why.) I hope it is now okay to examine phase by merely changing Phi in the mains voltage source.
I also updated the circuits using an NTC to use the properties of an Ametherm MS15 4004 (Rnom = 40R, dissipation constant = 49.4mW, thermal time constant = 114s, material beta = 3300). It has a maximum recommended energy rating of 135J (actual failure at twice that).
- Home
- Amplifiers
- Power Supplies
- Soft start circuit design and other psu issues