If you have time could you post some screenshots of the process? Always seems clearer when you can see what is being done 🙂
Here is a link to the tuto made by Jimbee in French. When I have time, I will try to translate, but the screenshots can help you already.
http://forums.melaudia.net/attachment.php?aid=16510
ok, so I do have have absorbers in the room and will add more but I still have an interest in using dsp to reduce the influence of the room.
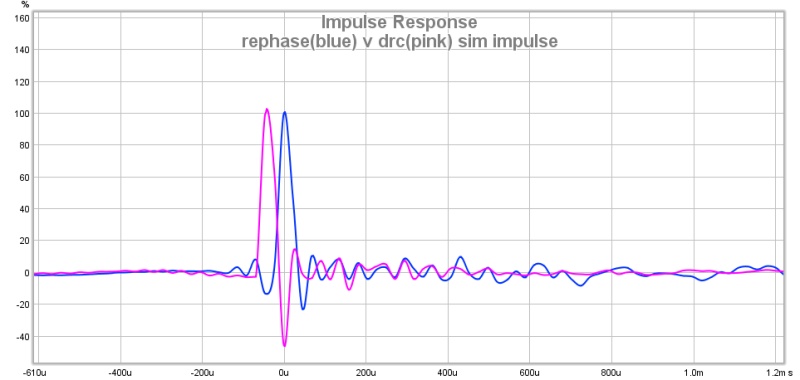
rephase does a great job fixing the speaker response and the sound is fantastic. it seems DRC (obviously) does a better job of removing the room, but not so great a job at fixing the speaker response
long time frame it seems drc wins(these are very aggressive settings that Ive not listened to)

speaker response rephase wins(ive listened to this and it sounds great)
I'd like to know more about what you have tried in DRC. It has so many variables to steer it's correction that it's pretty hard to try all combinations.
I use a custom template with my own settings, not any of the more standard templates, to do my correction. It uses a variable frequency dependant window. I'll admit I worked on that for months on end to try and relate what I hear to what I see in the several graphs you can get out of a single IR.
I've worked on that for over 3/4 of a year with measurements, and even more simulations. Non stop I may add day in day out to figure out what's happening.
I'm pretty sure I could come close with other tools, but only after really learning the tools at hand.
Can you show what it is you tried? Over here or in the dedicated DRC thread?
Here is a link to the tuto made by Jimbee in French. When I have time, I will try to translate, but the screenshots can help you already.
http://forums.melaudia.net/attachment.php?aid=16510
Thanks for the link, with the pictures and some rusty old French I think I get it 🙂 Seems a straightforward process and the measured result is good.
I was thinking that REW auto EQ was being used first to make the frequency response flat and extracting minimum phase from that for the excess phase removal process. Maybe that is easier to linearize as the EQ will help to flatten the phase but I suppose it doesn't really matter where you do it.
Do you know how much latency a convolution like that introduces?
OK, I understand. It is difficult to directly compare smoothing (of which FDW can be considered a special case) between different software packages as there is no standard for the filter kernels that should be used. REW and Acourate use the same (or very similar) definitions for their FDWs from what I have seen, if you would like more detail in the REW view use a higher cycle count.
Hello John,
It makes sense you compared your methods to Acourate. I remember when Bob Katz requested the feature and you started working on it. I was following that from the beginning. I was following Bob Katz's journey when he moved from Audiolense to Acourate to learn from his experience.
I would not want to increase the cycle count, as that would mean I would look over a longer time frame (in a room at the listening position).
I also realise Acourate has it's own ways of dip limiting compared to DRC-FIR.
I'm perfectly happy to use different tools for different jobs though. It's trough the generosity of people like yourself, Pos and Denis Sbragion that we have tools like these at our disposal at all.
The APL plots looks like wavelet spectrograms to me, have you tried REW's spectrogram in wavelet mode?
Before APL TDA was introduced to us on this forum I used DRC-FIR, JRiver and REW exclusively. Actually that's all I used to find all the answers I wanted/needed.
I have compared APL TDA to all other plots in REW. Here is a link to my first use of APL TDA. It shows both the wavelet from REW and the APL_TDA result.


I can't say they look the same to me. As said, the APL plot is derived from a huge amount of FDW's which makes it show a lot more of the little variations over time.
I haven't used any other APL tool yet for processing but I do like what it can show me. Like I said, the waterfall plots in REW show similarities if we look at them with settings optimised for a small frequency window. Basically I was using my "own" frequency dependent windows within all of REW graphs to show me the data I was after. This means looking trough all graphs while slowly adjusting the timing settings. That way you get to see how a Spectrogram builds up or how a waterfall grows as the frequencies get lower. This gave me an idea of the data over time. APL TDA plotted in one go what I was able to derive by flipping though all of those plots (gradually increasing time) in REW.
I still believe it's a very useful way to look at Audio data at the listening spot. By using all of these frequency dependent slices to look at that same data we do get to see that part (the timing) more clearly.
Currently I only use APL TDA as a confirmation tool of the data I see in REW.
Last edited:
Averaging and aligning a selection of measurements were already on the ToDo list, I'll add the excess phase export to that.What @JohnPM could consider is:
- adding a function in REW to adjust a batch of measurements in the time domain using the existing 'Estimate IR Delay' function
- adding a function to average a batch of measurements without having to make it 2 by 2.
<snip>
What @JohnPM could consider at this stage is the possibility to export the excess phase directly from REW (instead of heaving to export the minimum phase impulse, reimport it and use the A/B function to produce the excess phase). This would save a lot of manual operations.
As is the REW wavelet spectrogram (well, 100 anyway, whether that counts as huge... 🙂)the APL plot is derived from a huge amount of FDW's
The plots look similar to me, allowing for the different colour scheme and data range. If you enable the option to plot the peak energy curve and increase the scale range in REW you may see a more similar presentation. Bear in mind the frequency resolution setting has a strong influence on the presentation in the trade-off between time and frequency resolution.
As is the REW wavelet spectrogram (well, 100 anyway, whether that counts as huge... 🙂)
The plots look similar to me, allowing for the different colour scheme and data range. If you enable the option to plot the peak energy curve and increase the scale range in REW you may see a more similar presentation. Bear in mind the frequency resolution setting has a strong influence on the presentation in the trade-off between time and frequency resolution.
Similar but not the same. Each of them has it's own function. For my personal goals APL_TDA has been a useful tool for confirmation. I have used the peak energy curve. It's not the same as seeing the data in APL TDA though.
It's not criticism that made me post this. As said, the plots serve a different function. I can relate all graphs to each other, but use them for different purposes.
If you're interested you can play with the free demo of APL TDA to see what it does. I don't necessarily "see" differences, but it took way more effort to actually see the same in REW (back in time). There isn't a setting in REW I didn't try, honestly. 🙂
What I wanted to know is how the wave front builds up over time. This part of APL's TDA is about time only. The AFR plot in the same program is for frequency response.
I do realise a frequency plot is way more useful to see actual frequency data.
At the time when I was building my DSP correction the frequency dependent windows weren't available in REW yet (time frame about Jan - Sept 2015). The introduction of those have made the search so much easier (for me) when they became available. Starting with REW V5.13 beta3 which included the new psychoacoustic smoothing (which I still have, saved on my PC). And of course the introduction of the FDW in the release that followed.
All of these tools have helped me link what I hear to what I measure. If we Include the fact we actually listen with 2 ears (which has bigger consequences than most might realize) and our brain process certain aspects of sound differently from other parts. More information to link what we hear to what we measure is always welcome. For instance, perceived tonality is generally gathered over a longer time frame than most imaging queues.
I do see now, why the FDW in REW is different from DRC-FIR, and it's good to know were that difference came from.
Looking forward to the implementation of the Averaging of multiple measurements! I'm sure I'll be a thankful user of that feature!
Averaging and aligning a selection of measurements were already on the ToDo list, I'll add the excess phase export to that.
Thank you John 🙂
@JohnPM: Any chance of getting a 'REW wavelet spectrogram' kind of plot of joining two measurements.
The time axis can then be time delay between the filters?
The time delay can be translated to phase or difference in distance.
It would be a great feature to compare off axis response of different filters.
Torgeirs
The time axis can then be time delay between the filters?
The time delay can be translated to phase or difference in distance.
It would be a great feature to compare off axis response of different filters.
Torgeirs
Here is a short tutorial in English: https://www.dropbox.com/s/10xdhh83jokzbxv/REW_rePhase_tuto.pdf?dl=0
Very good tutorial on this very specialised optimation.
Downsides (May be showstoppers or don't care🙂):
*Almost 0.7 seconds of delay because of FIR length
*Sweetspot is only one head in one place.
Upsides
*Do not try to correct cancellations (Because of reflections 180 degrees out of phase/combfilter)
*Sweetspot is minimised so it is less chance for overcorrection at one ear when room or obstacles are asymetric left/right
For correction of larger spaces and low frequency it is usefull to first have a look at the ROOM sim in REW and see the variance in bass response inside that space.
JBL (Ref Toole) has come out with an prosessor for non ideal listening areas this spring.
Intonato 24 Products | JBL Professional
Last edited:
For the ones wanting a 'control room' listning space, the
https://tech.ebu.ch/docs/tech/tech3276.pdf can give you some clues.
It is from 1998 so some wil probably dismiss it.
Relevant for this disscussion is:
2.2. Early reflections
2.4. Operational room response curve
Appendix 1
Appendix 3 (to 2.5)
To fullfill these requirements, FIR filtering must be used with care as off axis parameters are essential
(I have actually worked a year in 1994 to check similar EBU requirements in the control rooms of NRK, Norway, using MLSSA.)
Hello torgeirs,
FIR filtering (or any kind of filtering/EQ for that matter) should never be used to address anything else than the direct sound, or what could be assimilated to it (eg low frequency boundaries effects).
FIR will not help with avoiding early reflections, creating an ISD gap and the like (well, it could at one point in space...).
It could be used to simulate a coherent (complementary to the real one) reflection field or an ISD termination, but that would require long FIRs. I think wesayso used pure delay for his assisted ISD termination, but a FIR could certainly do that with added possibilities.
I'm not really following what you mean there Torgeirs, maybe best to email me with more details.@JohnPM: Any chance of getting a 'REW wavelet spectrogram' kind of plot of joining two measurements.
The time axis can then be time delay between the filters?
The time delay can be translated to phase or difference in distance.
It would be a great feature to compare off axis response of different filters.
Thanks, that is more like I thought from your description 🙂Here is a short tutorial in English: https://www.dropbox.com/s/10xdhh83jokzbxv/REW_rePhase_tuto.pdf?dl=0
Thanks for the appreciation. In my case, I am using a two seats coach wide parallelipiped.Very good tutorial on this very specialised optimation.
Downsides (May be showstoppers or don't care🙂):
*Almost 0.7 seconds of delay because of FIR length
*Sweetspot is only one head in one place.
I have used this for the speakers' placement in order to optimize the bass response in the room. Room correction came afterwards.For correction of larger spaces and low frequency it is usefull to first have a look at the ROOM sim in REW and see the variance in bass response inside that space.
@POS. Thank you for your effort and input, it is much appriciated. After 20 years in telecom audio is now only a hobby, but your effort makes it possible to try out new and old ideas🙂
@SwissBear. Thank you for documenting so I do not have to reinvent the wheel. Hope your coach is not directly besides a concreet wall, I'm shure it's not. Glad to see you use the old school trick of placing the speakers so standing waves and early reflections are minimized and spread out in the frequency spectrum.
@JohnPM. I'll send you a mail. And, of course, thank you for an excellent program.
I have added a button in the All SPL controls to produce a minimum phase version of a measurement as a separate entry, and a button to directly generate the excess phase of a measurement (by generating and dividing by a minimum phase version), I'll add some further buttons to simplify the other steps of SwissBear's tutorial.

I have added a button in the All SPL controls to produce a minimum phase version of a measurement as a separate entry, and a button to directly generate the excess phase of a measurement (by generating and dividing by a minimum phase version), I'll add some further buttons to simplify the other steps of SwissBear's tutorial.
Wow,that's awesome. Thanks
I have added a button in the All SPL controls to produce a minimum phase version of a measurement as a separate entry, and a button to directly generate the excess phase of a measurement (by generating and dividing by a minimum phase version), I'll add some further buttons to simplify the other steps of SwissBear's tutorial.
Thank you John ! This is huge 🙂
- Home
- Design & Build
- Software Tools
- rePhase, a loudspeaker phase linearization, EQ and FIR filtering tool