Any reply?
Not much different in measurement floor or by the numbers..... just a well integrated HD/SW package at an attractive combo price.
THx-RNMarsh
Not much different in measurement floor or by the numbers..... just a well integrated HD/SW package at an attractive combo price.
THx-RNMarsh
Thanks, Richard. Since I have the soundcard already, I may spare the $200 of the QA400 for a better use…
So I'm going to throw a question into the mix here that might help some of us and the more experienced can explain. I understand signal to noise (SNR) and how it is measured / calculated. How do you determine the noise or where the noise threshold is or noise floor? Is this something calculated or measured? I seem to recall something about a 60dB number used in the measurement. I searched the web a bit, but nothing has jumped right out at me.
So I'm going to throw a question into the mix here that might help some of us and the more experienced can explain. I understand signal to noise (SNR) and how it is measured / calculated. How do you determine the noise or where the noise threshold is or noise floor? Is this something calculated or measured? I seem to recall something about a 60dB number used in the measurement. I searched the web a bit, but nothing has jumped right out at me.
Dave there are two possible SNR measures. One is signal to the 1Hz noise and the other is the total noise power in a bandwidth to signal level. The first you can calculate visually.
The second you have to choose a bandwidth and let the SW calculate the noise. It's just a ratio. Quite literally SNR.
Thanks David. I'm going to ask you to elaborate on the on 1Hz noise. I was doing some more web searching and I came across an article that helps explain the detail of the FFT, but noise floor and SNR are still a bit of a calculation (from FFT) nightmare for me.
Here is the article link: http://ww1.microchip.com/downloads/en/AppNotes/00681a.pdf
I know my equipment can measure the SNR, but I like to know how it measures it. Most of what I have reviewed involves math that is honestly over my head!
Thanks,
Dave
Here is the article link: http://ww1.microchip.com/downloads/en/AppNotes/00681a.pdf
I know my equipment can measure the SNR, but I like to know how it measures it. Most of what I have reviewed involves math that is honestly over my head!
Thanks,
Dave
Thanks David. I'm going to ask you to elaborate on the on 1Hz noise. I was doing some more web searching and I came across an article that helps explain the detail of the FFT, but noise floor and SNR are still a bit of a calculation (from FFT) nightmare for me.
Here is the article link: http://ww1.microchip.com/downloads/en/AppNotes/00681a.pdf
I know my equipment can measure the SNR, but I like to know how it measures it. Most of what I have reviewed involves math that is honestly over my head!
Thanks,
Dave
1Hz noise is what you see on the FFT plot a any one frequency. You're probably familiar with the expression x/rtHz. This is the noise within a defined bandwidth reduced to a 1Hz bandwidth. It makes it possible to calculate the noise in any defined bandwidth.
The QA400 lets you define your measurement bandwidth. it calculate the total noise power within the specified bandwidth and this is what displays. The noise in the bandwidth involves integrating the the noise in every bin and can look quite complex. it adds up all little bits of noise and uses this to calculate the noise bandwidth. In something like the 339a analyzer the total noise power is measured by an RMS detector. The output of the detector is averaged.
In something like the 339a analyzer the total noise power is measured by an RMS detector. The output of the detector is averaged.
So, in my HP 8903, it probably uses an RMS detector as well. I don't have the manual at the moment...
Using ARTA, it does not have a SNR value when you are using the FFT, but I recall if you remove the signal source to the DUT and take a measurement, the RMS level becomes the SNR. I would assume the DUT would be shorted or terminated appropriately.
Just looked in the ARTA manual: "Note: If there is no signal at the card input, then RMS shows the input channel S/N ratio." So, if the DUT is connected to the input of the sound card, but no input signal applied ot the DUT, then ARTA would measure the SNR of the DUT. Yes / No ?
Last edited:
So, I built a resistor ladder, with 33 ohms and 10 ohms. Generatiung a 1000 Hz test tone at 0dB provides a signal of 1.31 V RMS at the midpoint of the ladder.
The BNC to alligator connects signal to the center of the ladder. The impedance of the load was set to 43 ohms, a 1K Hz signal was generated at -10dBFS. The chart is the first below.
The second chart is a 4K signal at -10dbFS. It shows almost exclusively, 3rd harmonic.
I am not sure if I set the impedance correctly..... the impedance the amp sees is 43 ohms. The impedance that the analyzer sees is between the gnd and signal: 10 ohms.... what figure should I use?
Attachments


Last edited:
I've changed the resistor ladder to a 10 ohm and a 2.2 ohm. I made up a BNC to RCA cable with quad star cabling. I used a terminator for the BNC plug end, and ground it down until the terminating resistor was free and pulled it out.
Then, heavily tinning a cut off from a cap/resistor, it was inserted into the BNC and heated up. It held. Shrink wrap was used to insulate the cutoff from the body of the connector, and the RCA was soldered to the other side.
On a test tone, a meter shows 2.5 V output at the mid point of the resistor ladder. The amp was fully warmed up.
The test ends like the attachment, but it took several minutes to get there... it started up around 5 or 6 percent distortion, then slowly dropped to what is in the attachment.
Is that normal behaviour to start very high then drop? What could cause that?
Thanks.
Attachments

You do not need such low value resistors in your divider and you do not need the output voltage to be so close to the limit of the input of the QA400. I would build a /100 divider- a 1K resistor in series with a 10 Ohm resistor (its not actually correct but the divider error won't destroy the information). The 1K won't load the amp significantly and the ratio will reduce the peak voltage to a level the QA400 can handle. Use a separate load resistor to stress the amp. It would need probably at least 50W dissipation.
Again, you need to find the source of the hum. I am probably scaling incorrectly but it seems the hum is 50 dB below the level at the output. I'm guessing that its about 30 mV or so at 50 dB below 10V. You should be able to get much better. 90 db is a typical number and 120 db is possible with very careful design.
I think the distortion you see changing as the amp warms up is the fets biasing shifting to the operating value. Normally Powerfets have a negative tempco with the current for a given bias voltage dropping as they warm up. Bipolars are the opposite, which can lead to thermal runaway.
Thanks! I will change the divider.
A loop back test of the QA400 shows excellent results, and no hum. So, it is not part of the test rig.
BTW: Should I be exporting the results of the loopback test at each frequency of interest to subtract from the measurements of the DUT to attain the *actual* THD for the DUT?
That would be a *really* cool calibration routine to add to the unit.
Attachments

Last edited:
BTW: Should I be exporting the results of the loopback test at each frequency of interest to subtract from the measurements of the DUT to attain the *actual* THD for the DUT?
That would be a *really* cool calibration routine to add to the unit.
And a lie. The harmonics do not add and subtract nicely that way. You need the internal harmonics to be at least 6 dB or more lower than anything you are measuring. When they get closer they can add or subtract depending on the phase relationship and you really get no useful results.
I hope the divider helps.
Ah, phase... I see. So, it is only possible to null the contribution of the test device if you know the phase relationships, which we don't. THANKS for that!
The 1K/10ohm ladder is not good right now. There is too much noise to get the harmonics out of the grass.
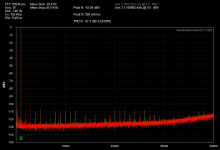
However, I sense there may be something wrong here. Please see the attached graphs.
The output is being taken from a resistor ladder of R1=33, R2=10 ( R2 is connected to ground) across an F5T ( gain approx 23 dB). V2 is voltage across R2.
Calculations show that it is 1.47 VAC RMS however, the analyzer reports it as shown in the chart.
No external gains are in use.
Why is the output window not showing 3.35 dBV? Instead, it shows -37 dBV.
Attachments


The QA400 is calibrated for 1.27Vrms full scale. If you input 3.35dBV that's 1.47Vrms. This will drive the QA400 into hard clipping. You need to input a useful voltage no more than 316.23mVrms (-10dBV). Otherwise you will only see the distortion of the QA400 input amplifiers. Don't assume the output from your attenuator. Confirm it with another meter.
Most DMM will work to 500Hz. You can reduce the gen frequency to < 500 Hz and get a fairly accurate measurement in the AC setting of a DMM or other AC volt meter.
It would be helpful for us if you include a screen shot of the QA400 control panel along with your plots.
Demian explained this to you in a recent post. If you are not going to take our advice then it's difficult for us to help you.
Sorry davada, I'm struggling with understanding this for some reason. It should be simple.
I will try to do something more sensible. The next post will be clearer, and hopefully without error. Anything that resembles a loopback works perfectly... eg DCB1.
There is much noise down low, around 60,180,300 420 etc... regardless of whether I run loopback or through and amp or preamp.
Thanks for your help, and I hope to not wear out your patience.
Truthfully, I would prefer to use the QA190 than a resistor ladder.
- Home
- Design & Build
- Equipment & Tools
- QuantAsylum QA400 and QA401