(I could use a real USB-C PD tester but those are real $$$)
more testing-
1) 3 USB 2 hubs. The QA401 enumerates correctly only on one (which aslo has a serial and parallel port on it)
2) using a good bench supply and raising the supply to 5.25V (max legit) at the USB-A end and still get the really lousy results with bad cable and good results with good cable.
Now to check for obvious screwups in the cable fab, like short between shield and ground. . .
Hi Demian,
I have been able to read lower current draw on the odd bad cable. Since these only cost me about $2.99 each, they have paid for themselves many times over. Having adapters would be great. I guess you can't run them backwards? I have never tried.
-Chris
For the most part I agree with you. I have a pair of them since they don't all fit in the same spaces.Its not useful to measure at the PC end of the cable.
I have been able to read lower current draw on the odd bad cable. Since these only cost me about $2.99 each, they have paid for themselves many times over. Having adapters would be great. I guess you can't run them backwards? I have never tried.
-Chris
I got the ASIO working with Etienne's help and prodding. Below is DiAna + QA401 + Victor's oscillator. DiAna does a great job of showing just the harmonics and their relationships.The waveform shows where to look to improve things.
Hi Demian,
This may be a dumb question and I may be showing my ignorance here, but what is DiAna and how is it being used with the QA401?
Cheers,
Bob
This may be a dumb question and I may be showing my ignorance here, but what is DiAna and how is it being used with the QA401?
See here DiAna
Diana is a good distortion analysis program. See the screenshot above I posted. It reconstructs the distortion waveform as well as the harmonics without noise. Similar to the Shibasoku.
Hi Demian,
This may be a dumb question and I may be showing my ignorance here, but what is DiAna and how is it being used with the QA401?
Cheers,
Bob
Edmond Stuart's baby.
Jan
Bob I'm shocked you haven't seen this. It brought end to all my software projects. Simply can't do better. DiAna, a software Distortion AnalyzerHi Demian,
This may be a dumb question and I may be showing my ignorance here, but what is DiAna and how is it being used with the QA401?
Cheers,
Bob
Hello all-
First post, I'm fairly new owner of a 401 & 450. Looking forward to learning how to make them work to their fullest. And I have to say the support folks are really amazing. Glad to be here!
First post, I'm fairly new owner of a 401 & 450. Looking forward to learning how to make them work to their fullest. And I have to say the support folks are really amazing. Glad to be here!
I just confirmed that the QA401 + the ASIO401 driver works pretty well in Reaper, so now there is a way to play and record unlimited length test files. Next step would be to listen to the QA401 (why would anyone do that???).
I just confirmed that the QA401 + the ASIO401 driver works pretty well in Reaper, so now there is a way to play and record unlimited length test files.
Thanks to someone mentioning it here I resurrected my Focusrite and tried their latest driver which fixed the problems. To my surprise my 19 yr. old shareware version of Cooledit suddenly works full duplex at 24/96. I have not found an ASIO driver that was recognized by Cooledit since XP.
does that make it vintage and sound better?
No, It's sort of funny in a way. Cooledit had ASIO support built in 20yr. ago and it was reawakened without any intervention needed at all.
It had become such an orphan, I don't think I looked at CoolEditPro since the early 90's
Of course that means that it will all be 32 bit and one wonders what the internal dithering realities are.
Cheers
Alan
Of course that means that it will all be 32 bit and one wonders what the internal dithering realities are.
Cheers
Alan
Of course that means that it will all be 32 bit and one wonders what the internal dithering realities are.
Still my preferred app for simple looking at stereo waveforms as data, in fact I used it at work with a sound card modified to do DC rather than Labview and an NI DAS.
QA401 Release 1.726 posted yesterday on GitHub
This release continues to focus on streamlining workflow and making it as easy as possible to build some fairly sophisticated graphs directly the in app and minimize the time you need to spend in other apps importing/massaging/exporting data.
The basic idea is that you make a measurement sweep, generate a graph, make a tweak, make another sweep and then push the output of that sweep to the previously created graph. And then the graph tool let's you interactively pretty everything up (min/max on axis values, trace widths, titles, notes, colors, etc)
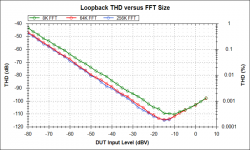
The "THD FFT Size" plot below is a look at THD versus FFT size using this technique. Sweep, change FFT size, sweep, change FFT size, etc. At each step, keep pushing the output to the same graph.
This post HERE shows the process while making measurements on TI's TPA3255 2x300W class D amp.
This post HERE reviews the types of sweeps you can make in the 1.726 release.
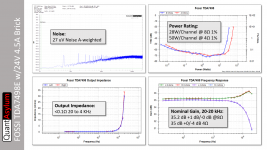
If you need to generate project documentation from your measurements, then the easiest way to do so is to run all the sweeps you want, pretty up the graphs in the QA401 graphing tool, and then copy them all as same-size bitmaps and paste them into PowerPoint. Then arrange as desired, and then group them and re-size them all at once to fit the page. Below is a summary on a Class D amp based on TI's TDA7498 from a company called Fosi. The total time to make the measurements, build the graphs, and group them in PowerPoint and add the text, drop shadows, banner, etc, is around 20 minutes.
Comments on what seems confusing or broken and where to improve are always welcome
Thanks, Matt
This release continues to focus on streamlining workflow and making it as easy as possible to build some fairly sophisticated graphs directly the in app and minimize the time you need to spend in other apps importing/massaging/exporting data.
The basic idea is that you make a measurement sweep, generate a graph, make a tweak, make another sweep and then push the output of that sweep to the previously created graph. And then the graph tool let's you interactively pretty everything up (min/max on axis values, trace widths, titles, notes, colors, etc)
The "THD FFT Size" plot below is a look at THD versus FFT size using this technique. Sweep, change FFT size, sweep, change FFT size, etc. At each step, keep pushing the output to the same graph.
This post HERE shows the process while making measurements on TI's TPA3255 2x300W class D amp.
This post HERE reviews the types of sweeps you can make in the 1.726 release.
If you need to generate project documentation from your measurements, then the easiest way to do so is to run all the sweeps you want, pretty up the graphs in the QA401 graphing tool, and then copy them all as same-size bitmaps and paste them into PowerPoint. Then arrange as desired, and then group them and re-size them all at once to fit the page. Below is a summary on a Class D amp based on TI's TDA7498 from a company called Fosi. The total time to make the measurements, build the graphs, and group them in PowerPoint and add the text, drop shadows, banner, etc, is around 20 minutes.
Comments on what seems confusing or broken and where to improve are always welcome
Thanks, Matt
Attachments
Newbie question.... I've been away from this for such a long time, I've re-qualified.
I've built a resistor ladder 7 ohms/1ohm, with fukushima MPC74 1ohm/5 watt resistors. to aample across the 1 ohm resistor nearest speaker ground, but that means more adaptors, and an output level needs to be chosen so as not to overdrive the input.
It occurred to me that a BNC to RCA for input and a dual banana plug to BNC for the output, putting the 8 ohm resistor across the amp outputs would do, but with a different input signal level.
If the device under test has a gain of 22 dB ( it is an F5T ), then, should the output of the QA400 output a -32dB signal to get a -10dB signal at the input? Is that how that works?
Thanks in advance.
Yes , but don't forget the 18dB loss introduced by the 8ohm resistor ladder so the output of the QA400 needs to be -14dB to get a -10dB input (WITH the resistor ladder in place )If the device under test has a gain of 22 dB ( it is an F5T ), then, should the output of the QA400 output a -32dB signal to get a -10dB signal at the input? Is that how that works?
- Home
- Design & Build
- Equipment & Tools
- QuantAsylum QA400 and QA401