Figured cocobolo and the name plate is curly maple.
There isn't much stuff where I live but West Penn hardwood is only about a 40 minute drive. One can get lost in their wharehouse.
There isn't much stuff where I live but West Penn hardwood is only about a 40 minute drive. One can get lost in their wharehouse.
Okay, dark outside now and waiting for paint to dry. Had a few moments to do some slueth work on the square wave tilt. Found a couple of issues tonight.
1) Input cap was too small for reduced impedance. Took back to 100k and waveflattened out. I reduce the impedance b3 I found out I had a bad 12bh7 a while back.
2) type of wire used for signal and feedback was CHEAP radio shack audio wire. Had alot of weird noise. Replaced with good teflon coated twisted silver wire and signal cleaned up.
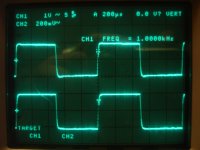
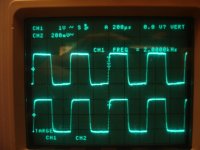
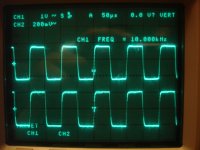
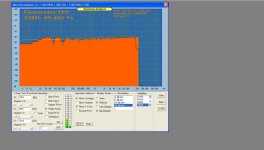
Attached are the sqaure waves at 1kHz, 2kHz, and 10 kHz. at 20 watts power. As was suggested before, could use a little more knee but don'thave the values to do it right now.
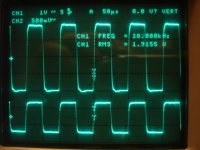
The fourth picture is the square wave at full power. For all traces I was using 10x probe on 5Ohm dummy load. Measurement was taken acros the dummy load.
1) Input cap was too small for reduced impedance. Took back to 100k and waveflattened out. I reduce the impedance b3 I found out I had a bad 12bh7 a while back.
2) type of wire used for signal and feedback was CHEAP radio shack audio wire. Had alot of weird noise. Replaced with good teflon coated twisted silver wire and signal cleaned up.
Attached are the sqaure waves at 1kHz, 2kHz, and 10 kHz. at 20 watts power. As was suggested before, could use a little more knee but don'thave the values to do it right now.
The fourth picture is the square wave at full power. For all traces I was using 10x probe on 5Ohm dummy load. Measurement was taken acros the dummy load.
Attachments
Yes Salas you are/where correct. Thanks for giving me a point to ponder which helped.
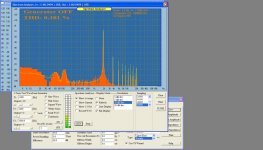
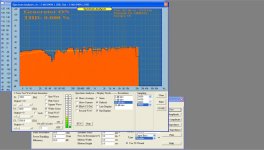
Attached is some distortion measurements. Used a 2kHz sine wave 60Watt, 30Watt, 10Watt, and Line Input. I also show pink noise last. The 2kHz signal is from my function generator which should have much lower distortion than it is showing. The pink noise is sourced from the soundcard. I have to find a more accurate method. My soundcard setup just doesn't do it for accuracy. But I guess they are useful in relative terms.
The distortion is pretty constant from 500Hz to 20kHz. I start to loose resolution somewhere above 10kHz as the higher orders are not visable.
Is there any other measurements to make before I tear it apart, put it in the chassis and get the other channel going?
Attachments

An informative set.
What is the THD for 1W 8 Ohm 1kHz (is it the -20dB? 0.6W more likely) and is it completely flat on white noise? I see you have only ''show 3rd octave'', so we should see white. Also some IMD.
P.S. See that your Emu setting window matches your chosen sampling rate in the FFT. I see many harmonics in the last octave.
The -20dB is the source spectra taken at the input of the amp. I included it to give a refernce point to the rest of the data. My sound card system is horrible presently. When I get back from traveling the week after next, I am going to finish the sound card interface and make some new test leads. I made these a while back out of the same cheap radio shack wire I had problems with earlier.
The 1 Watt 5Ohm is identical to plot number 3.
With white noise I see some roll off around 10 to 15hHz. I did not check show 1/3rd during the test.
What are the standards for the IMD test?
P.S. The EMU and FFT are set to 96000Hz. The harmonics I think are coming from the test leads I made for the sound card.
I could see weird ringing on my osciliscope the other night when I was probing through the amp. It went away when I replaced the signal and feedback wires I was using for the breadboard connections. Not sure why it didn't dawn on me when I did these tests
Last edited:
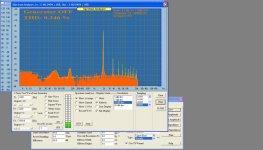
Made a quick/ (better?) test lead. Here is 1W into 5ohm at 2k. And then White noise with and without the input cap respectively. For the White noise I click 1/3 octave and average.
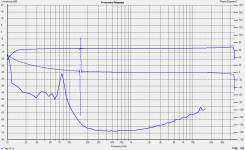
The slight increase in gain at the higher frequencies is the result of my soundcard cal file (or lack there of). I have to make a new one as it was in the AWOL folder that had my speaker data.
The last plot is the freq/phase/thd plot. This is calibrated. Ignore the phase glitch at 150Hz.
The slight increase in gain at the higher frequencies is the result of my soundcard cal file (or lack there of). I have to make a new one as it was in the AWOL folder that had my speaker data.
The last plot is the freq/phase/thd plot. This is calibrated. Ignore the phase glitch at 150Hz.
Attachments

Last edited:
Now it looks much more like it for THD spectra and reading %. Take the tick out from ''show 1/3 octave'' when with white noise. Also at 48kHz sampling the Emu will do better. Use 1kHz measuring tone so it can be easier to compare with general. IMD standard is 70Hz and 6kHz 4:1.
I have to find a more accurate method. My soundcard setup just doesn't do it for accuracy. But I guess they are useful in relative terms.
What sound card do you have? I built Pete's interface, but found that it didn't help at all as my sound card is the root of the problem. I have since put an Audiophile 192 in there but have not taken the setup for a test drive yet because I don't like the software I am using either.
What software are you using? Do you like it?
I am using my laptop with a USB E-Mu 0404 as the soundcard. I bought audio tester but it is not very stable. I have been using it sparingly
For the most part I am using SoundEasy for spectrum and HolmImpulse for sweeps.
I have a spare Audiophile 192 but need a test bench other than my dining room table to be able to use a full size pc. That will come later once I finish my wife's kitchen ;-). I will need to be careful on how fast I finish my office/lab so as not to create the impression that I was dragging my feet on the kitchen if you know what I mean.
the 0404 is suppose to be decent, at least I thought. I was hoping that the soundcard interface would at least improve the issue of impedances between DUT, Voltage divider, and the sound card.
Each one seems to have their advantage/disadvantage. I think Holmimpulse does a nice job and is easy to calibrate and export graphs. It is limited in what functions it can do as it was designed for speaker measurement. Soundeasy has a steep learning curve and has limited export function. It is also a PITA to set up soundcard calibration. Audioanalyzer seems pretty easy to use but it keeps crashing and glitching. I have let my German slide since I got out of college so reading the dialogs is a pain. I am looking for better and open to suggestions.
Last edited:
audioTester is what I have been trying to use and I agree...it is unstable and a bit persnickety when it isn't crashing. SoundEasy looks expensive. HolmImpulse looks promising...better than what I have now. I have a Velleman PCS500 scope and K8016 signal generator, so I can do basic FFT and Bode plots but that's about it.
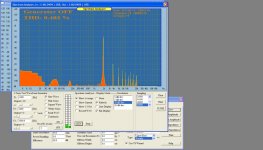
The THD is very good. The IMD could be better, and I suspect its the harmonic noise you got to the left that mixes. Now if you run 1kHz and 10kHz 4:1 and goes much lower, its the hum for sure. Isn't there more resolution BTW? I see the skirt on the signal's base, must be 120Hz side bands but its one thing. Maybe it can resolve better for display?
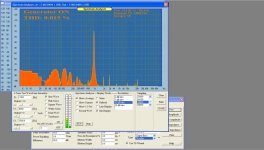
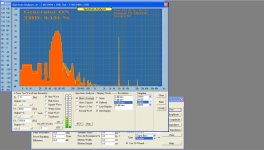
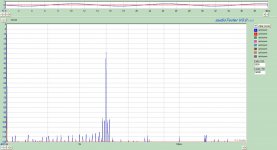
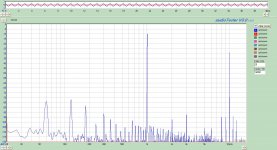
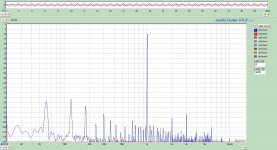
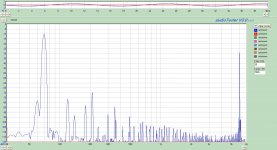
Okay I switched to audio tester. I will put four plots up. Baseline noise, 70/6khz, 1k/10khz, and 1khz thd. Much better resolution, can def see the sidebands.
P.S. Maybe now you can see th plots
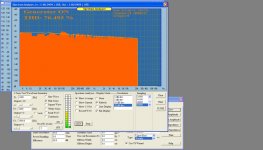
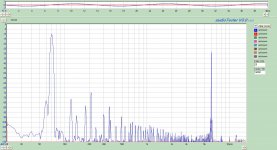
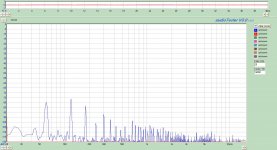
and I added some zoom plots. #3 is zoomed around 6kHz and the last is zoomed to show low end better
P.S. Maybe now you can see th plots
and I added some zoom plots. #3 is zoomed around 6kHz and the last is zoomed to show low end better
Attachments
Last edited:
Much better resolution... On 1kHZ+10kHz harmonically related IMD we see the 9+11k products at -63dB ref 10kHz and comparable to 2nd and 3rd harmonic amplitudes of the base tone. The non harmonically related 70Hz+6kHz tones SMPTE produce a better -70dB around 6kHz. That's good because those are the harsher. Still the amp is harmonic noise infested enough.
- Status
- Not open for further replies.
- Home
- Amplifiers
- Tubes / Valves
- OPUS 5.0 A Modern Mullard