Augerpro:
In your method the driver responses must have the exact extra phase difference which is caused by the AC offset that has to be determined.
But the problem I see with it, how you will obtain the individual responses with that correct phase difference caused by the AC offset. If it is not possible in the measurement equipment to set the start of the FFT at the same absolute time w.r.t. ‘time 0’ for both driver measurements, the phase difference due to AC offset will not be correct.
I think It can be done as follows. It is the same almost like I describe it in post 317, but easier.
First measure both single driver responses (mic between both drivers centers), and for each measurement, place the start of the FFT just before the impulse start to create the frequency response, SPL and phase, for both. These are responses that have a phase that is equal to the AC position phase (minimum phase to be expected).
Import in software, reverse the tweeter, calculate the sum response and find the offset of the tweeter for maximum cancellation.
Second, find the same cancellation but now by placing the drivers in parallel and shifting the microphone in vertical direction. The difference between this offset and the offset of the first measurement is the AC offset between both drivers.
I think it must be possible to find the same kind of cancellation with both measurements, also with a not so flat phase.
Last edited:
Matthias,
About your measurement procedure, it can work, but I think it has to be done as follows.
At first you have to know how much the reversed tweeter has to be moved backwards in an AC aligned condition for maximum cancellation.
At second you measure how much the reversed tweeter has to be moved backwards in the actual AC condition for maximum cancellation. That is what you have done now.
Hmm, I don't quite understand the difference between the two things. But yes, my method is not as good as it could be. I guess we should just forget about my not-so-great attempt...
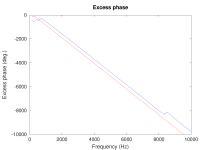
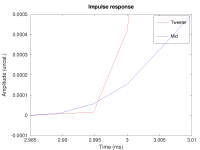
I have now added the loopback compensation (or "dual channel setup") to my setup, which completely removed the inconsistencies of the timing in the impulse response measurement. With this, I measured the impulse response of the tweeter and the mid, with the microphone exactly 1m away from the baffle and at the height of the vertical center of the tweeter and the mid. The data are shown in the attachments, and the tweeter impulse arrives at the microphone 0.029 ms later than the mid impulse (determined from the excess phase slope).
This corresponds to an offset of the acoustic centres of about 10mm. That's not too bad. Is it good enough, or should we try to further optimize that by moving the mid backwards? Sounds like a complicated baffle or a custom waveguide assembly for the VM752, and I am not sure we'd gain a lot from this.
Attachments

Last edited:
This image clearly shows the mid-range impulse is delayed compared to the tweeter's impulse.
ie; it's Acoustic Center is behind the tweeter's AC .
🙂
The peak-max or the peak-center of the mid is indeed later than the tweeter. This is simply because the impulse response of the mid is wider than that of the tweeter, which reflects the fact that the mid does lower frequencies than the tweeter. What counts is the BEGINNING of the peaks (i.e., when they arrive at the microphone). The attached zoom-in shows that the mid impulse arrives BEFORE the tweeter.
Attachments
Is this corroborated ( roughly supported ) by the relative locations of these driver's voice coils ?
🙂
🙂
Voice coils don't pump air molecules, the driver membrane does. And it is quite a difficult to say the plane of a dome or a cone, so acoustic measurement with loop-back timing is the only exact way to define that. At least mid and tweeter should be measured in the baffle from same mic location. A two-channel soundcard with loopback wire at channel 2 to lock timing. Looking at reverse null and summing or system's step is another way, but it can not be used for design software.
Doing simulated design is just simulation with some tolerance anyway, helps you to get on the map and avoid disasters. Final tweaking must be based on carefully performed acoustic measurements and auditioning, that's the salt and pepper of diy!
Doing simulated design is just simulation with some tolerance anyway, helps you to get on the map and avoid disasters. Final tweaking must be based on carefully performed acoustic measurements and auditioning, that's the salt and pepper of diy!
Last edited:
My baffle is 30cm wide with rounding radius 4cm, speaker in midline. Your test baffle looks narrower, and the dip is at same F left/right - doesn't match with baffle effect!
My guess is that the Volt's steep waveguide-like edges make it disperse like a 6" woofer. That dip is in factory datasheet too.
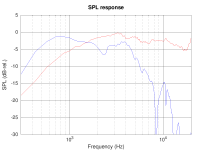
You are right. Assuming the SPL chart in the factory datasheet was measured on an IEC or similar "large" baffle, the dip at 2.2 kHz cannot be related to the baffle. The dip does get less off-axis, so I don't think it's a mechanical resonance within the dome/suspension. 2.2 kHz corresponds to a wavelength of 15.6 cm, which is about twice the dome diameter (7.8 cm). Is this a reflection/suck-out within the waveguide?
(P.S.: the dimensions of the Monkey Coffin prototype baffle are here. It is 36.8 cm wide, so a bit more than your example)
That's really really close to the same start. How deep is the waveguide in this?
The modified WG148 is about 19 or 20 mm deep (measured from the mouth plane to where the throat meets the surround). The VM752 waveguide is about 28 mm deep.
Is it good enough, or should we try to further optimize that by moving the mid backwards?
It is ok now. Btw, what is the sample frequency of your measurement system?
Designing a X-over now with amplitude perfect on target, the phase of the tweeter will lag a little, being 26 degrees at 2500 Hz. And this all is only true if the drivers are perfect minimum phase, which is also not the case at the bandwidth limit of the drivers maybe.
Designing the X-over a little off target outband also can improve phase behavior.
Last edited:
You are right. Assuming the SPL chart in the factory datasheet was measured on an IEC or similar "large" baffle, the dip at 2.2 kHz cannot be related to the baffle. The dip does get less off-axis, so I don't think it's a mechanical resonance within the dome/suspension. 2.2 kHz corresponds to a wavelength of 15.6 cm, which is about twice the dome diameter (7.8 cm). Is this a reflection/suck-out within the waveguide?
---
Funny that Volt's waveguide diameter is 158mm, matches quite well with 2,2kHz wavelength 156mm! Cone diameter looks irrelevant. And because the profile is so deep without rounding, this efffct gets so bad.
The 2" Volt has diameter 109mm and dip at 3,2kHz (107mm) but for some reason there is lots of smoothing in the datasheet measurement...
Jeff Bagby tested ATC75-150S, it doesn't show dip and has rounded edges in wg.
Last edited:
It is ok now. Btw, what is the sample frequency of your measurement system?
Designing a X-over now with amplitude perfect on target, the phase of the tweeter will lag a little, being 26 degrees at 2500 Hz. And this all is only true if the drivers are perfect minimum phase, which is also not the case at the bandwidth limit of the drivers maybe.
Designing the X-over a little off target outband also can improve phase behavior.
Sampling frequency was 192 kHz for these measurements (to get the best possible time resolution).
If the tweeter is 10 mm too far behind in the on-axis measurement, it will be perfectly aligned if the microphone (or my ears) are positioned about 7° upwards from the on-axis position. Sounds like a reasonable scenario in my intended listening room. 🙂
Funny that Volt's waveguide diameter is 158mm, matches quite well with 2,2kHz wavelength 156mm! Cone diameter looks irrelevant. And because the profile is so deep without rounding, this efffct gets so bad.
The 2" Volt has diameter 109mm and dip at 3,2kHz (107mm) but for some reason there is lots of smoothing in the datasheet measurement...
Jeff Bagby tested ATC75-150S, it doesn't show dip and has rounded edges in wg.
Good point about the ATC 75-150. The Hobby Hifi magazine recently published measurements of the Volt VM752 with a custom waveguide that was very similar to the ATC design, and I don't remember seeing the 2.2 kHz dip there. If the Volt waveguide really is the cause, and if we decide the 2.2 kHz dip is a serious issue, we can always make custom waveguide for the Volt. All it takes is someone with a 3D CAD system to make a suitable design, and builders can then send this file to a CNC or 3D printing service to get the custom waveguide. I will stay with the stock Volt waveguide for now since these are too many "ifs", and a we can always change to a custom waveguide later if needed.
Edit: the Hobby Hifi test is available here (make sure to click on the PDF links for a copy of the full review!). It was the Volt VM753, which is the same as the VM752 apart from the weaker magnet. The Hobby Hifi measurement also show a small dip at around 3 kHz with the round waveguide (on-axis only), so I am pretty sure the 2.2 kHz dip of the standard Volt VM752 is related to the acoustics of the waveguide.
Last edited:
In the picture of your prototype, I can see the cabinet stands close to a wall at the backside. No problem for AC measurements but for final frequency responses, it is better to measure more in the middle of a room. But you know that also...
Also important for FFT to place the start of the window exactly at the start of each impulse, just an information to be on the same design path 🙂.
Also important for FFT to place the start of the window exactly at the start of each impulse, just an information to be on the same design path 🙂.
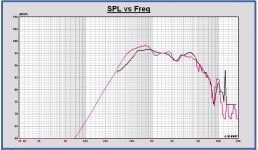
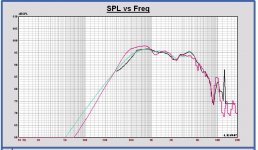
Just for a first idea I compared the Volt measurement with the simulations till now.
In the plot the red curve is the simulation and the black one the measurement (shifted +15 dB).
What concerns me at this moment is the response difference below 1 kHz.
There can be different reasons:
- Short FFT window with some smoothing and low frequency fall off as a consequence
- The driver has different parameters
- Leap bafflestep boost too optimistic
IMO it is best to measure each driver on its own axis at 1m from front baffle.
In simulation I see that for the Volt the SPL difference is already 2 dB at 20 kHz, measuring on its own axis vs. the axis between midrange and tweeter.
With corresponding phase shift already at 20 kHz.
The goal is to have correct responses at listening distance, being 3 m and more. So the best way of measuring the drivers is each driver on its own axis at 1 m. I do it like that for my own designs.
Attachments
Just for a first idea I compared the Volt measurement with the simulations till now.
Hi Paul -- please don't expect accurate SPL for those measurements. I didn't care too much about optimal time gating, and they are not calibrated in terms of absolute levels and microphone frequency response. I just made sure the timing is right to determine the offset of the acoustic centres. I will make proper SPL measurements soon, and I'll provide the data files so you don't need to digitize stuff from the diagrams.
Matthias, yes I understood that way. I just gave this information as an input for your final measurments 🙂.
Don't you have the place for a ground plane measurement? It gives very good low frequency measurement results.
I think to organize something in my garden next year with some large MDF plates on the ground in the middle of my garden and try it out 🙂
Don't you have the place for a ground plane measurement? It gives very good low frequency measurement results.
I think to organize something in my garden next year with some large MDF plates on the ground in the middle of my garden and try it out 🙂
Last edited:
Matthias, yes I understood that way. I just gave this information as an input for your final measurments 🙂.
Don't you have the place for a ground plane measurement? It gives very good low frequency measurement results.
I think to organize something in my garden next year with some large MDF plates on the ground in the middle of my garden and try it out 🙂
I have never done a ground plane measurement. I do have a garden, but no means to transport or store large MDF sheets or similar... So far I have been ok with gated implulse response measurements (> 300-400 Hz) and splicing this to nearfield measurements.
Hi Eelco,
I have made a driver model in Leap based on the datasheet SPL and TSP. Simulation in cabinet is done using a cabinet model also in Leap.
Later on I will adapt the driver model conform measurements of the Volt driver Matthias is using now.
I still have some doubts about the bafflestep simulation in Leap with some enclosure models.
I checked all with my own speaker, Leap simulations versus anechoic room measurements and they did match very well.
For me it is again very interesting to see how it will run now with this Monkey Box.
That makes sense. I have not checked, but most likely the Volt factory datasheet uses the IEC Baffle. It looks as if the simulation show a diffraction issue at approx 1.1 kHz, the 2.2kHz issue being a driver artefact.
Furthermore, the low-end roll off looks underdamped in comparison with the measurement Matthias made. Strange.
Furthermore, the low-end roll off looks underdamped in comparison with the measurement Matthias made. Strange.
Eelco:
I have added the infinite baffle model of the Volt driver in green color (red = simulation in cabinet, black is measurement in cabinet)
Based on that, the 1.1kHz dip is a diffraction dip that Leap simulates, which is not visible in the measurement. It is possibke that it is smoothed a little due to a too short FFT window.
I think the underdamped low frequency measurement result is due to a short FFT window or driver different parameters.
I think we better wait for Matthias' final measurements to have a better view on this.
Attachments
- Home
- Loudspeakers
- Multi-Way
- Open Source Monkey Box