
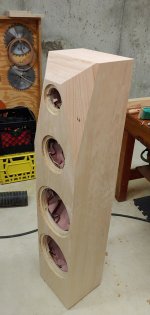
My bet is for the 2kHz midrange driver thing is baffle edge diffraction. This can be supported by the fact that there is no chamfer around the midrange driver, just sharp 90 degree edges to left and right and the edges are not close enough to the driver for the directivity of the driver to reduce the diffraction effect.
Baffle edge diffraction would show some widening or narrowing or variation of due to changing path length difference as measurement angle changes. A hump on-axis and some dip to sides for example, looks like narrowing. This seems to be about the same on all axis hence its more likely something else. There should be some diffraction as well somewhere around but I doubt its this particular feature on the graph.
A normalized horizontal response would show diffraction better, Jim would you mind posting one? 🙂 Polar map looks rather clean on post #183 though, nothing too bad but indeed some widening around 1k and 2k.
A normalized horizontal response would show diffraction better, Jim would you mind posting one? 🙂 Polar map looks rather clean on post #183 though, nothing too bad but indeed some widening around 1k and 2k.
Last edited:
Agree... the observed behavior does not look like a diffraction effect. I am not able to simulate a diffraction effect which looks like the observed data.
In my toneburst decay plots, I can clearly see a resonance at about 2k in the midrange plot.
Thank you, by the way, for all of your thoughts. Every idea or question that is proposed helps me clarify my thinking.
In my toneburst decay plots, I can clearly see a resonance at about 2k in the midrange plot.
Thank you, by the way, for all of your thoughts. Every idea or question that is proposed helps me clarify my thinking.
Hi Jim,
I may have missed it earlier in the thread but did you consider optimising for the predicted in l-room response? (And floor and/or ceiling bounce)…without compromising too much on LW or On Axis?

I have found that it is to ear is so sensitive to that range when you get it right you can turn it up all the way to 11 and listen all daylong
I think this is so because the ear so sensitive to the 2 to 8K range
Short-term double blonde trials a 30 second clips may make it hard to discern the difference but longer listening will make you where it is a clincher
I may have missed it earlier in the thread but did you consider optimising for the predicted in l-room response? (And floor and/or ceiling bounce)…without compromising too much on LW or On Axis?
I have found that it is to ear is so sensitive to that range when you get it right you can turn it up all the way to 11 and listen all daylong
I think this is so because the ear so sensitive to the 2 to 8K range
Short-term double blonde trials a 30 second clips may make it hard to discern the difference but longer listening will make you where it is a clincher
Last edited:
No I did not...I may have missed it earlier in the thread but did you consider optimising for the predicted in l-room response?
The priority at this point is optimizing the DI and listening window curves, while compromising to a degree the other performance aspects. I believe the architecture of this system will allow me, at a later time, to optimize the predicted in-room response, as well as other performance aspects.
My earlier projects convinced me that the predicted in-room response (as calculated according to CTA2034) do not match my measured in-room response. This is not really shocking, every room is different, and the standard is a best estimate of an average room.
So we will see how this beast sounds.
In other news, I just removed the drivers and the amp from the speaker, and I will begin work on finishing it. I have decided on cherry veneer.
After completing the cabinet finish, I will do further experimenting to see if the 2k problem can be mitigated.
Yes, that's what I thought, for example at 45 degree, 1,5kHz show about -3dB, 2kHz show -1dB, that definitely can be diffraction effect.nothing too bad but indeed some widening around 1k and 2k.
The infinite baffle off-axis measurement of the 15CAC/NBAC show no such widening.
Jim, if I remember correctly, your previous speaker cabinets have nice roundings on the whole height to alleviate the diffraction effect.
This is also important for the midrange driver, not just the tweeter.
Edit: the IB 45 degree off-axis show -0dB at 1,5kHz for the 15NBAC, so there is a narrowing effect, probably caused by the box/baffle dimensions and driver placement.
Last edited:
Yes that is correct. I used a 37 mm radius.Jim, if I remember correctly, your previous speaker cabinets have nice roundings on the whole height to alleviate the diffraction effect.
This is also important for the midrange driver, not just the tweeter.
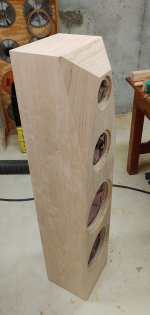
For this project, I wanted to try something different by going with the tapered bevels. I made the bevels as long as I could given my equipment, but I could not extend them past the center of the midrange. My VituixCad simulations seemed to indicate that radius edges made little difference on the mid driver... perhaps that is a limitation of the VCad baffle simulation.
When I get the drivers back into the finished boxes, I will try some EQ fixes, along with experimenting with flexible / isolation mounting of the drivers.
In any case, I really appreciate your thoughts.
Close range measurements of the mid might reveal the source of the resonance. Chances are an internal standing wave Is causing the one at 2k.The resonances I am seeing at 2k are in the 2 dB range, which is probably audible, but only just barely audible. The other resonances are closer to 1 dB and I am not too concerned about those. I am open to any theories as to the source of the resonance. I am open to ideas on how to mitigate...
j.
Everything in the tweeter looks like diffraction to me. At the same frequency the curves are behaving differently above and below that frequency. The response is rippled making it harder to see. It could be diffraction from the stand or measuring setup.The resonances I am seeing at 2k are in the 2 dB range, which is probably audible, but only just barely audible. The other resonances are closer to 1 dB and I am not too concerned about those. I am open to any theories as to the source of the resonance. I am open to ideas on how to mitigate...
The mid looks more resonant but it is also in a sawtooth pattern and approaching the point where resolution is being lost from gating.
I understand your motivation to listen the different options and make your own mind up. The difficulty I see here, is that the off axis measurements are varying too much between simulation and measurement to allow any definitive conclusions to be drawn. If you optimize the DI in a measurement and listen to it you have to be convinced you are actually listening to what you intended.The priority at this point is optimizing the DI and listening window curves, while compromising to a degree the other performance aspects. I believe the architecture of this system will allow me, at a later time, to optimize the predicted in-room response, as well as other performance aspects.
Being active there is no harm in trying different options and comparing, it is unlikely the best design will come from optimising one particular trait. It is the balance and compromise of all the factors that matters. I doubt you will like a peak in the off axis response whatever the DI.
I am following this thread with great interest as i am also working on my WWMT with twin 8' woofers. Thusfar i am learning the tools like Arta and Vituixcad so that i understand those and get repeatable results.
To my understanding and following the thought given by Tktran303, if that hump is "ironed out" then this should also smoothen the DI curves, am i right?

To my understanding and following the thought given by Tktran303, if that hump is "ironed out" then this should also smoothen the DI curves, am i right?
Probably yes. The directivity unevenness in the treble range we see in the graphs mainly caused by the directivity mismatch between the midrange and tweeter drivers and the typical polar response of a bare dome tweeter. A waveguide for the tweeter would help a lot about this and there are more excellent options from augerpro for this particular tweeter.To my understanding and following the thought given by Tktran303, if that hump is "ironed out" then this should also smoothen the DI curves, am i right?
https://www.somasonus.net/sb-acoustics-sb26
Last edited:
Yeah, DI is difference of power response to reference axis. By definition one needs flat or at least smooth DI to be able to achieve smooth power And reference axis response, electronic filters will affect both. All of it depends how power is calculated, could be horizontal axis only or both horizontal and vertical, more or less angles etc. In the end its the construct, the structure and the drivers and their location that makes the power response, and DI. Then there is some effect around crossovers because multiple transducers play at the same time making interference. Interference happens also due to sou d from edge diffraction and port resonances to name a few.
A normalized horizontal response would show diffraction better, Jim would you mind posting one? 🙂 Polar map looks rather clean on post #183 though, nothing too bad but indeed some widening around 1k and 2k.
Attachments
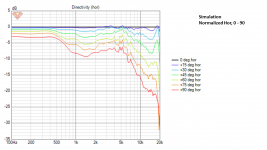
Thanks, nice. Are the responses marked as simulation made with the diffraction tool using datasheet response or what are we looking at?
The simulations seem to be very close to measured response. Additional ripple on the measured response would be mixture of second order diffraction stuff and driver break up, perhaps also something else. These would be missing from diffraction tool results. For example the listening window dip between 4-7kHz I suspect is quite wild cone breakup, perhaps center is decoupled from the edge or something like that, attenuation on axis but as path length difference increases to side it mellows out some.
Yeah the blimp around 2k can be EQ:d. Normalized response shows what if the system was EQ'd flat and the wiggle on the off axis responses show how the driver and structure borne coverage and interference. The blimp is gone though, perhaps it was internal mode leaking out.
Last edited:
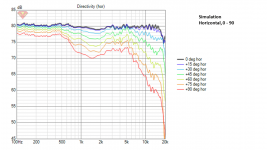
For the simulation, I measured all four drivers near field and far field, according to the VituixCad instructions. The baffle response was simulated for each driver, and the near field response was modified to be 4-pi equivalent. The far field response was made at 39 inches (1 M), on the vertical axis of each driver. Horizontal polar measurements were taken from 0 to 180 degrees in 15 degree increments. Due to symmetry, I made polar measurements to one side only. Vertical polar measurements were not made, in accordance to VCad guidance, so therefore the software will assume the driver vertical response is equal to the horizontal response. The merging of near field and far field was done according to VCad instructions.Thanks, nice. Are the responses marked as simulation made with the diffraction tool using datasheet response or what are we looking at?
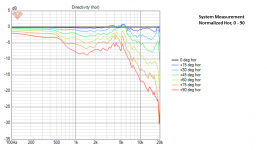
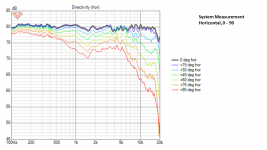
For the System measurement, I made far field gated polar measurements in both vertical and horizontal planes, 0 to 180 and 0 to -180. These measurements were all made on a common axis. The system level polar measurements were loaded into VCad as a single virtual driver.
The simulations seem to be very close to measured response. Additional ripple on the measured response would be mixture of second order diffraction stuff and driver break up, perhaps also something else. These would be missing from diffraction tool results. For example the listening window dip between 4-7kHz I suspect is quite wild cone breakup, perhaps center is decoupled from the edge or something like that, attenuation on axis but as path length difference increases to side it mellows out some.
One thing that none of us are addressing is Fluid's observation that the horizontal off-axis system measurement is different than the simulation. I did not really get this until studying all the comments this morning. If we look at the normalized plots in post#235, the system measured responses at 45, 60, 75 degrees, from 3k - 5k, are 2 dB higher than the simulation. Even with 1/3 octave smoothing, the difference remains. I don't understand why this difference exists, but I have a theory.
Until I understand the source of this difference, I won't be able to rely on simulation. Once I get the drivers and the amps put back into the cabinets, I will be able to run this issue to ground.
j.
Here is the difference I think, in system measurement of mid driver the mic and perhaps rotation center is not at same location as it was measurement for simulation, on axis of the mid driver.These measurements were all made on a common axis.
I have the veneer complete on one speaker. The other speaker still needs the bevels to be done, which I will do tomorrow. Veneering the bevels is very exacting work. I need a beer !
Attachments
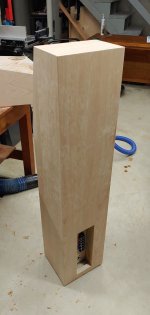
 It looks great. What are your finishing plans?
- Home
- Loudspeakers
- Multi-Way
- New Project - tower 3-way with twin 8s