Good spot.Here is the difference I think, in system measurement of mid driver the mic and perhaps rotation center is not at same location as it was measurement for simulation, on axis of the mid driver.
vituixCAD2 user manual encourages this:
“Elevation of mic is at the center point of driver under test i.e. mic and driver have the same Y-coordinate in mm. Turn speaker back/front if front baffle is tilted. Tilt turning table front with ground plane measurement to aim driver’s axis towards the mic while hor 0 deg measurement.
Exception 1: Mid and tweeter can be measured at common mic elevation = average Y of center points if drivers are small and close to each other, baffle is straight (non-stepped) and vertical plane is not measured i.e. drivers are circular and hor/ver difference in baffle diffraction is ignored on purpose.”
Reference:
https://kimmosaunisto.net/Software/...20.html#Checklist_for_designing_a_loudspeaker
But overall it’s challenging to know what the exact differences are. We need someone with a Klippel NFS to document the differences in simulation and actual measurements.
Erin Hardison has done it; but only with on-axis. And it’s very close.
I still suspect the error is accumulative- in taking accurate measurements with the gated FF blended to NF measurements technique as well as the simulation together.
Last edited:
clear satin polyurethane. I use General Finishes oil-based finish. I brush on 2 or 3 coats, sand with 220 grit, then brush on a final coat.Wow. Well done, Jim. Have a cold one and take a breather.It looks great. What are your finishing plans?
This same procedure works well with gloss polyurethane when used on open pore wood such as oak or mahogany. For a gloss finish on a closed pore wood like cherry or maple, I would brush on 3 coats, sand with 220 grit, apply a 4th coat, sand with 320 grit, and then apply the final coat.

Tktran & Tmuikku - thanks for your thoughts.
It is possible that this is the source of my difficulty, and I have been moving in a similar train of thought. The driver-level measurements were each taken on the axis of that driver. The tweeter on its axis, the mid on its axis, etc. These measurements were made with no filtering in place, just the raw driver response, and only the driver under test was active (obviously). These responses were fed into VituixCad for simulation.
For the system-level measurements, all the drivers are active, and all of the DSP filtering was in place. I had to select a single microphone position, and I chose the design axis. This mic position matches the 0,0 (x,y) axis in the VCad simulation, which is vertically centered between the tweeter and the mid, halfway between them.
If I made the driver level measurements of the mid and tweeter from the design axis (midway between them), I might get better agreement between simulation and system-level measurements. Why? The amount of edge bevel that the mid and tweeter see varies significantly with vertical position. On the mid axis, the driver "sees" little edge radius. On the design axis, the mid "sees" a significant 35 mm bevel.
Another thing I plan to do is to make the driver-level measurements in both the horizontal and vertical planes. VCad assumes the driver vertical polars are the same as the horizontal polars, and on a typical rectangular baffle, this is probably close enough. However, this speaker is very tall and narrow, and it has significant edge radius in one area only. So I should probably give VCad a good vertical polar response for the mid and tweeter.
j.
@hifijim my apologies if you've already explained this.
Why is your tweeter and midrange CTC spacing quite wide? I saw a vertical polar and the nulling that was occuring around the XO between tweeter and midrange and wondered if there was an aesthetic or other technical reason for the wider CTC spacing?
Why is your tweeter and midrange CTC spacing quite wide? I saw a vertical polar and the nulling that was occuring around the XO between tweeter and midrange and wondered if there was an aesthetic or other technical reason for the wider CTC spacing?
This post covers it... https://www.diyaudio.com/community/...3-way-with-twin-8s.378223/page-6#post-7017084
The short version - a 1.2 x wavelength CtC distance performs really well in simulation... with 2nd, 3rd, or 4th order crossovers, but particularly well with 3rd order.
j.
The short version - a 1.2 x wavelength CtC distance performs really well in simulation... with 2nd, 3rd, or 4th order crossovers, but particularly well with 3rd order.
j.
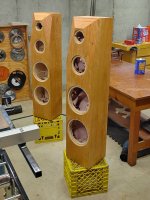
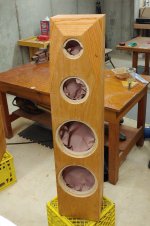
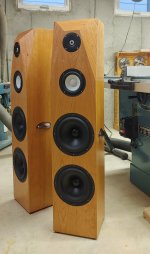
I am ready to begin the next round of testing and DSP filter development. Cabinets are finished, drivers installed.
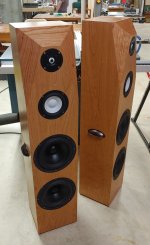
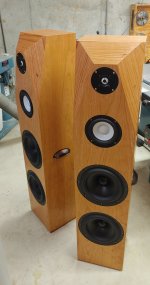
I am pleased with the look of the natural (non-tinted/non-stained) cherry. Years ago, I built a lot of cherry furniture with a natural finish, and it tends to slightly darken over time, and the reddish rose tints become more prominent.
I installed bronze handles, the least obtrusive I could find. Without handles, it is impossible for a single person to carry these. Even the process of building and finishing them was difficult because of the weight (and I am not 30 years old anymore!)...
Back in post#88 I considered making each cabinet in two parts, a woofer box, and a mid-tweeter box to sit on top. Vineethkumar is doing his project this way. I definitely see the attraction, after wrestling these beasts around my workshop for the past month. I don't think I will ever again build a single-box loudspeaker of this size again.
If I get time tomorrow, testing will begin 🙂
j.
Attachments
This is a bit of a conundrum which is why I was questioning the directivity response of the drivers earlier on.It is possible that this is the source of my difficulty, and I have been moving in a similar train of thought. The driver-level measurements were each taken on the axis of that driver. The tweeter on its axis, the mid on its axis, etc. These measurements were made with no filtering in place, just the raw driver response, and only the driver under test was active (obviously). These responses were fed into VituixCad for simulation.
For the system-level measurements, all the drivers are active, and all of the DSP filtering was in place. I had to select a single microphone position, and I chose the design axis. This mic position matches the 0,0 (x,y) axis in the VCad simulation, which is vertically centered between the tweeter and the mid, halfway between them.
If I made the driver level measurements of the mid and tweeter from the design axis (midway between them), I might get better agreement between simulation and system-level measurements. Why? The amount of edge bevel that the mid and tweeter see varies significantly with vertical position. On the mid axis, the driver "sees" little edge radius. On the design axis, the mid "sees" a significant 35 mm bevel.
Another thing I plan to do is to make the driver-level measurements in both the horizontal and vertical planes. VCad assumes the driver vertical polars are the same as the horizontal polars, and on a typical rectangular baffle, this is probably close enough. However, this speaker is very tall and narrow, and it has significant edge radius in one area only. So I should probably give VCad a good vertical polar response for the mid and tweeter.
If you remember back to the idealized drivers thread, you showed that Vituix did a good job of coming up with the same answer in both cases.
https://www.diyaudio.com/community/...ations-with-ideal-drivers.380658/post-6890798
Measuring on axis to allow simulation of different driver positions should match to reality when all of those drivers are measured in the real thing from a single point. If that didn't work Vituix would be useless, which it is not, so there must be something going on to cause such a discrepancy in this situation.
Yes, I am certain that some kind of measurement error has slipped into my measurements, but I don't know the source. I am hoping that if I start from scratch, and retake all the measurements... the error will simply go away. Wishful thinking perhaps.
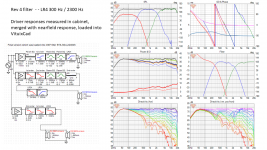
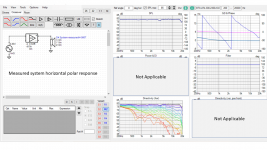
I have completed the next phase of testing. I made a new set of horizontal polar measurements of each driver, 0 – 180 degrees in 15 degree increments. The speaker was elevated such that my gate window for both the mid and tweeter was a bit over 5 ms before the first reflection (floor). I made a new set of near field measurements of each driver, and these were merged with the far field gated responses in accordance with VituixCad instructions.
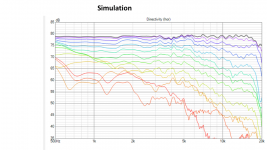
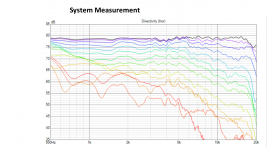
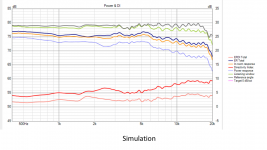
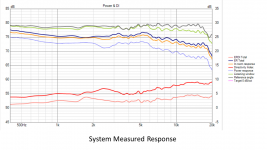
Using these new measurements in Vcad, I developed a new DSP filter. The goal of this phase of testing is to achieve a close agreement between simulation and system-level measured results. To make developmental testing easier, I used 4th order filters so that all drivers are in-phase. I also decided to make the on-axis response flat, which also makes development and evaluation easier. Final EQ to achieve a desired in-room response can be easily added at any time.
The filter I developed has a moderate level of driver EQ, Linkwitz Transform on the woofers, and LR4 crossovers at 300 Hz and 2300 Hz. It is not optimized for DI performance, and I don’t expect this will be the final DSP filter, but it is a good filter to make evaluations and comparisons between simulation and test.
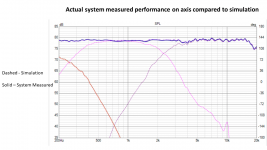
In my previous system level testing, the off-axis response from 2k to 5k was about 2 dB higher than the simulation (post #237). This was my prime motivation to re-conduct this testing. I am quite pleased that with the new test data, I have extremely good correlation between simulation and system level test results.
The system level measurements are horizontal polar… I made no vertical polar measurements. Therefore I blocked out the “Power & DI” plot because it is not valid.
j.
Using these new measurements in Vcad, I developed a new DSP filter. The goal of this phase of testing is to achieve a close agreement between simulation and system-level measured results. To make developmental testing easier, I used 4th order filters so that all drivers are in-phase. I also decided to make the on-axis response flat, which also makes development and evaluation easier. Final EQ to achieve a desired in-room response can be easily added at any time.
The filter I developed has a moderate level of driver EQ, Linkwitz Transform on the woofers, and LR4 crossovers at 300 Hz and 2300 Hz. It is not optimized for DI performance, and I don’t expect this will be the final DSP filter, but it is a good filter to make evaluations and comparisons between simulation and test.
In my previous system level testing, the off-axis response from 2k to 5k was about 2 dB higher than the simulation (post #237). This was my prime motivation to re-conduct this testing. I am quite pleased that with the new test data, I have extremely good correlation between simulation and system level test results.
The system level measurements are horizontal polar… I made no vertical polar measurements. Therefore I blocked out the “Power & DI” plot because it is not valid.
j.
Attachments
Glad it worked out Jim. 👍
I really need to my bottom into gear and write/record that “How to design speakers with measurements”
https://www.diyaudio.com/community/threads/how-to-design-a-speaker-using-measurements.385687/
It does save a lot of hard work and heartache when one follows Kimmo’s wonderful (but super dense) instructions- it’s easy to overlook one or two small, but critical, steps and end up chasing one’s tail.
Last edited:
Yes, so true. I did not identify concretely the source of my error in the data collected around post #167. But I believe it was a combination of two things... (1) I was allowing the speaker to tip backwards a few degrees while making polar measurements, and this may have affected both the magnitude and phase of the responses. (2) I made an error when I merged the low frequency response into the far field response on the midrange and woofer.It does save a lot of hard work and heartache when one follows Kimmo’s wonderful (but super dense) instructions- it’s easy to overlook one or two small, but critical, steps and end up chasing one’s tail.
A few other things I want to point out.
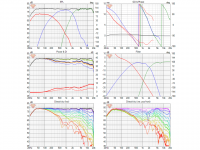
In slide 4 and 5 above, the detailed horizontal polar plots, I show response from 500 Hz up. I don't want to show data lower than 500 Hz because that is where I merge the near field response. I do not fully trust the directivity data below 500 Hz. My room is simply not large enough to get good resolution below that, and Vcad is probably making a software-best-estimate of polar response in the region below merge... so it is not really measured data. And this is fine. This speaker is a sealed box design, and I don't need measurements to know that it becomes omnidirectional (DI = 0) somewhere between 100 and 500 Hz. I would need to measure directivity down to 100 Hz if this was a cardioid design, or a MEH perhaps. But it is not.
The next step will be to make vertical polar measurements of the system, so I can verify the simulation prediction of DI, ERDI, and other power related responses. But first I have to modify the rotating table to accommodate the handle and to ensure it does not mare the finish.
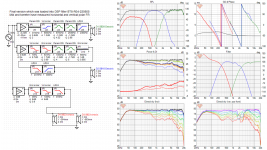
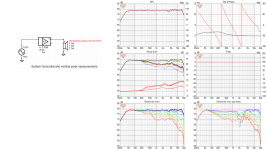
I have completed the vertical polar measurements. I am glad that is behind me.
I made vertical polar responses of the speaker system, and also the midrange and tweeter individually.
The results look really good. When VituixCad has the benefit of using a full set of horizontal and vertical polar measurements for each driver, the resulting simulation is a very close match to reality… reality in this case being a set of polar measurements of the entire system.
As I showed in post#250, the horizontal responses show extremely close agreement between simulation and measured. In the vertical plane, the comparison is good, but not as close as the horizontal. However, the detail differences at certain angles do not seem to affect the calculation of power response, early reflections, listening window, or predicted in-room response.
As before, I do not believe that I have good directivity resolution below 500 Hz, so I am limiting the Power & DI graphic to 500 Hz and up.
j.
Attachments
I don't want to show data lower than 500 Hz because that is where I merge the near field response. I do not fully trust the directivity data below 500 Hz. My room is simply not large enough to get good resolution below that, and Vcad is probably making a software-best-estimate of polar response in the region below merge... so it is not really measured data. And this is fine. This speaker is a sealed box design, and I don't need measurements to know that it becomes omnidirectional (DI = 0) somewhere between 100 and 500 Hz.
My gate window is about 5 ms, depending on the location of the first reflection. This means I get resolution down to 600 Hz at 1/3 octave, and down to 400 Hz at 1/2 octave. My merge with near field is typically about 500 Hz.
Below the merge, VituixCad has no measured data except for on-axis near field data. All of the other information it uses is based on calculations, such as cabinet diffraction results. I am certain that it is a really good simulation of polar response, but strictly speaking, it is not measured data.
In order to make legitimate polar measurements below 500 Hz, I would need to go outdoors and make groundplane polar measurements (not on the menu). Or build a rotating tower (definitely no).
I'm with you Jim,
Instead of building a rotating tower, consider a island kitchen table, with wheels. Kitchen cabinetry seem to be commodity items and are available at many outlets, such as the ubiquitous IKEA. Easier/cheaper to acquire and quicker to put together than designing your own.
I "borrowed" my wife's kitchen island table; it makes a good dual purpose equipment rack- I keep my amp, audio interface, laser distance measurer, cables etc on the shelves/rack, cutting down on setting up/packing up time.
Just wheel in/out and go.
I don't have a handy photo of mine on it's own, but it's small sturdy table with shelving, 2 wheels on one end, handle on the other, supports 200+ lbs, to which you could put your speaker on top, high enough to give you a 10ms gate (100Hz resolution).
Here is my rotating turntable on top of the rotating kitchen island table.
Imagine removing the turntable and putting on your floor standing speaker (or in my case, bass bins) on top of the island table. Hope this helps.
greetings from Anechoic Australia
Last edited:
Looks like the poor dog has expired from to many frequency sweeps, maybe you need to set the maximum frequency to 40Khz just to bring him back to life.I'm with you Jim,
Instead of building a rotating tower, consider a island kitchen table, with wheels. Kitchen cabinetry seem to be commodity items and are available at many outlets, such as the ubiquitous IKEA. Easier/cheaper to acquire and quicker to put together than designing your own.
I "borrowed" my wife's kitchen island table; it makes a good dual purpose equipment rack- I keep my amp, audio interface, laser distance measurer, cables etc on the shelves/rack, cutting down on setting up/packing up time.
Just wheel in/out and go.
I don't have a handy photo of mine on it's own, but it's small sturdy table with shelving, 2 wheels on one end, handle on the other, supports 200+ lbs, to which you could put your speaker on top, high enough to give you a 10ms gate (100Hz resolution).
Here is my rotating turntable on top of the rotating kitchen island table.
Imagine removing the turntable and putting on your floor standing speaker (or in my case, bass bins) on top of the island table. Hope this helps.
View attachment 1082034
greetings from Anechoic Australia
I appreciate the ideas. Nice looking dog. Australian trees are very different than the trees in midwestern North America 🙂
The more difficult problem is lifting 80 lb to a height of almost 3 meters. To do low frequency measurements with a 10 ms gate, I would need the woofers to be 2 m above the ground, which means the top of the speakers would be over 3 m.
A ground plane polar measurement would be much more feasible for me... in fact, I could do it today without too much difficulty. I just do not see the value in measuring the directivity of a monopole speaker below 500 Hz... I am 100% certain that the DI is going to go from 4 dB at 500 Hz to 0 dB at 100 Hz... There is no way this speaker will somehow start behaving like a dipole or a cardioid.
I am going to do a groundplane measurement in the near future, but on-axis only... this is just to verify that the woofer levels are set correctly and that the Linkwitz Transform is working as intended.
Now that I know I can simulate the loudspeaker system with accuracy to within 1 dB, I am confident in experimenting with new DSP filters, including some which will produce the smoothest possible DI.
This got me good. I have to keep the cat out of the garage because he yells when the sweeps run and ruins the measurements. Like a parrot, his loudest meow with eeevery sweep about 2/3rd of the way through. Likes music though.Looks like the poor dog has expired from to many frequency sweeps, maybe you need to set the maximum frequency to 40Khz just to bring him back to life.
Keep up the good work jim, enjoying following this one, and love the cabinet work too.
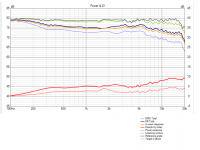
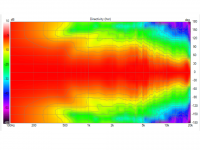
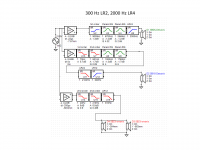
Here is the filter I have been listening to for the last couple of days. I made changes from the baseline using VituixCad simulation and critical listening evaluations. The upper crossover is now 2 kHz LR4. The lower crossover is 300 Hz LR2. Simulation indicates that the DI is +/- 1 dB from 300 Hz to 6 kHz. All of the Power&DI curves look nice. The horizontal dispersion trends are well behaved out to 90 degrees.
It sounds good, really good. Smooth, detailed, very articulate bass, good imaging.
At the start of the project, I was curious if the large CTC distance between mid and tweeter would cause me problems. The simulations were good, but how would it sound in real life? As far as I can tell, there is no sonic downside to the 1.2xwavelength spacing. Although I have a large listening room, I sit rather close to my speakers, about 8 ft distance. I get no sense of disconnect between the mid and the tweeter. Even at a distance of 4 ft, the sound seems integrated.
The change from 2.3k to 2.0k upper crossover was a subtle difference. I noticed slightly more congestion, or homogenized sound, on female vocals and horns with 2.3k. The 2.0k had more clarity, but it was a very slight difference.
The change from 300 LR4 to 300 LR2 was not subtle. The soundstage became more spacious, imaging was more precise. Bass instruments and drums had more impact and punch. I really noticed it on fast moving electric bass, drums, and piano.
This surprised me, because my main system sounds best with a 200 Hz LR4 crossover between the 12” woofer and the 6” mid driver. On that system, I lose a bit of detail when using LR2 filters.
Next step is to try some 3rd order filters to see how they sound. I also need to install a slightly down-tilted EQ on one of the Hypex presets. The current flat frequency response is just right for most jazz and classical, but as expected, it is too bright for pop music. For pop/rock I usually prefer a gentle -4 dB drop from 100 Hz to 10 kHz.
j.
Attachments
- Home
- Loudspeakers
- Multi-Way
- New Project - tower 3-way with twin 8s