Link stage, better say Link Level Stage, is a component with input at hundreds of mVrms or units of Vrms (e.g. CD player) and output for power amp, i.e. in Vrms and expected load impedance 600 ohm and more.
link stage
some would call it a preamp, others might call it a buffer, and some a line level stage.
But all could be called a link stage.
It "links" a source component to a receiver component.
some would call it a preamp, others might call it a buffer, and some a line level stage.
But all could be called a link stage.
It "links" a source component to a receiver component.
Re: link stage
In my book it's line stage, but definitely it LINKS. Clever name!
AndrewT said:some would call it a preamp, others might call it a buffer, and some a line level stage.
But all could be called a link stage.
It "links" a source component to a receiver component.
In my book it's line stage, but definitely it LINKS. Clever name!
While all soundcard pros are here I would like to ask what the maximum input voltage is approximately for these cards. Last thing I heared was that some cards allow only small input signals of the order of 1 V.
Of course that's only of limited value, so I would be glad if it was otherwise.
Have fun, Hannes
Of course that's only of limited value, so I would be glad if it was otherwise.
Have fun, Hannes
Re: Re: link stage
is that another innovation down to PMA?estman said:In my book it's line stage, but definitely it LINKS. Clever name!
There are pro sound cards and then there are consumer cards. You need to look at the pro sound cards.
Still, you need some form of signal conditioning for power amps.
Signal conditioning with protection circuitry is a good idea even if you test only RIAA amps as when testing prototypes you never know when you will have DC rails at the output 😉
Sigurd
Still, you need some form of signal conditioning for power amps.
Signal conditioning with protection circuitry is a good idea even if you test only RIAA amps as when testing prototypes you never know when you will have DC rails at the output 😉
Sigurd
h_a said:While all soundcard pros are here I would like to ask what the maximum input voltage is approximately for these cards. Last thing I heared was that some cards allow only small input signals of the order of 1 V.
Of course that's only of limited value, so I would be glad if it was otherwise.
Have fun, Hannes
Yes, BJT and MOSFET and JFET as output devices for line level amps in follower circuits.
For sims I use MOSFET and JFET models but they are in general not as good as BJT models (for distortion).
Sigurd
For sims I use MOSFET and JFET models but they are in general not as good as BJT models (for distortion).
Sigurd
estman said:
Sigurd, thanks for your opinion. Do you have real experience with both of them - measurement and/or listening? Sim?
PMA could you please post Output impedance vs Frequency graph from MicroCap simulation?
Thanks, Borko.
Thanks, Borko.
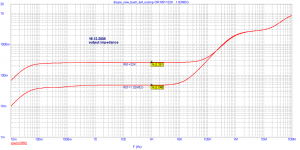
PMA said:The lower trace is for VAS unloaded, the upper trace is for VAS with 22k load.
Hmmm... So at (say) 1KHz the output impedance is 5 times higher with the VAS loaded. This is obviously because of the OLG decrease by the VAS load http://www.diyaudio.com/forums/showthread.php?postid=1702968#post1702968
Nothing unexpected so far, but then care to explain why other parameters (THD, etc...) seem to be unaffected by this OLG decrease?
It was pretty tough to me explain it in Czech language on our forum. The case is that the basic condition of the classical feedback theory is not fullfilled - there is no ideal subtractor in the input, due to high emitter degeneration and Rbias + Rbias divider. But I will try in English too.
Look, this preamp has LOWER distortion after VAS load then without VAS load. Optimum VAS load is 22k - 30k. There is an influence with distortion cancellation NPN-PNP curves. I am telling you my secrets 😀
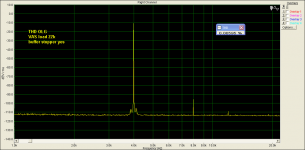
First, let us start with MEASURED OLG THD, with VAS loaded by 22k. OLG (A openloop) is 32,9dB in this case.
Look, this preamp has LOWER distortion after VAS load then without VAS load. Optimum VAS load is 22k - 30k. There is an influence with distortion cancellation NPN-PNP curves. I am telling you my secrets 😀
First, let us start with MEASURED OLG THD, with VAS loaded by 22k. OLG (A openloop) is 32,9dB in this case.
Attachments
Now, several numbers from SIMULATION, as simulation fits with measurements quite well. Only measured distortion is a bit higher, depending on NPN-PNP matching.
1) VAS not loaded
openloop gain Aol = 58.2dB
closed loop gain Acl = 12.4dB
loop gain βA = 45.8dB
THD with open loop = 0.0085%
THD with closed loop = 0.00038% (you see it does not fit)
2) VAS loaded by 22k
Aol = 32.9dB
Acl = 12dB
βA = 20.9dB
THD with open loop = 0.0024%
THD with closed loop = 0.00033%
So, usual assumption that THD after closing loop is βA lower than openloop THD does not work here.
If the circuit was biased byCCS and had lower degeneration, the basic equations would work. BUT the dynamic behaviour would be changed the way I do not want, AND OLG would not be flat high above audio band, the condition I want to be fullfilled.
Regarding higher output impedance with VAS loaded: distortion is lower in case of the 'usual' link stage loading, i.e. 600 ohm and higher. In case of hard loading, like 32 ohm headphones, distortion is lower with VAS unloaded.
I hope we are in 'normal' communication status now, Ovidiu 😉
I hope we are in 'normal' communication status now, Ovidiu 😉
PMA said:Now, several numbers from SIMULATION, as simulation fits with measurements quite well. Only measured distortion is a bit higher, depending on NPN-PNP matching.
1) VAS not loaded
openloop gain Aol = 58.2dB
closed loop gain Acl = 12.4dB
loop gain ²A = 45.8dB
THD with open loop = 0.0085%
THD with closed loop = 0.00038% (you see it does not fit)
2) VAS loaded by 22k
Aol = 32.9dB
Acl = 12dB
²A = 20.9dB
THD with open loop = 0.0024%
THD with closed loop = 0.00033%
So, usual assumption that THD after closing loop is ²A lower than openloop THD does not work here.
If the circuit was biased byCCS and had lower degeneration, the basic equations would work. BUT the dynamic behaviour would be changed the way I do not want, AND OLG would not be flat high above audio band, the condition I want to be fullfilled.
All these (Aol, Acl, loop gain, etc...) are at what frequencies? I'm still confused by these results. All I can tell is that loop gain at the THD frequency is not worth a penny specifying. What helps is the loop gain at each of the spectral components frequencies.
Example:
An amp has OLG of 60dB at 20KHz, 40dB at 40KHz and 20dB at 60KHz. Assume the open loop amp has 10V output with 2mV 2nd harmonic and 1mV 3rd harmonic, accounting for about 0.022% THD20 in total.
After closing the loop, the 2nd harmonic will be 0.02mV and 3rd harmonic will be 0.1mV, accounting for about 0.001% THD20 in total.
a) Simply dividing the open loop THD20 by the loop gain at 20KHz doesn't work. Comparing OLGs at 20KHz makes sense only in a single pole 20dB/decade approach.
b) Feedback can reverse the dominant harmonic. In the above example, 2nd harmonic is dominant in the open loop, while after closing the loop the third harmonic is dominant.
Does this apply to your amp?
PMA said:I hope we are in 'normal' communication status now, Ovidiu
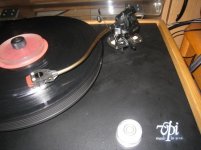
I finally finished upgrading my TT (not for long though, more is coming 😉
VPI HW-19 with HRX Platter/Bearing and VPI SAMA motor, SME Series III tonearm, Clearaudio Symphony Wood cartridge.
Sounds amazing with HPS 2.0 I reversed the cables and I was unable to hear any differences. I am very dissapointed 🙁
Attachments
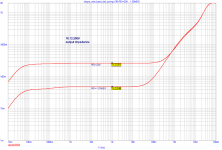
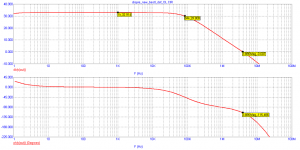
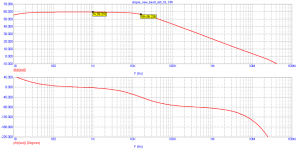
I know this, but simulated Aol curve, without VAS load, has F(-3dB) corner at 15kHz and at 350kHz when VAS is loaded by 22k. This is without rev. V3, and this is how it was simulated.
After V3, i.e. 68pF cap in buffer, simulated Aol (F-3dB) corner is at about 4kHz without VAS load and about 84kHz with VAS load.
OLG plot for VAS loaded by 22k, without rev. V3:
After V3, i.e. 68pF cap in buffer, simulated Aol (F-3dB) corner is at about 4kHz without VAS load and about 84kHz with VAS load.
OLG plot for VAS loaded by 22k, without rev. V3:
Attachments

- Home
- Source & Line
- Analog Line Level
- New DISPRE preamp, successor to previous popular version