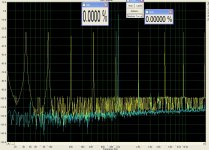
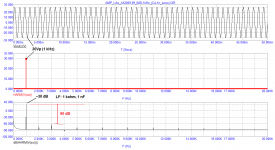
Real measurements ,my amp, multitone signal..Output attenuated cca 30dB. Amp with total GD (inclusive input LP) about 450ns. Amp alone about 210ns. This is reality, no "strange" theory.
Great posting. It shows already in some way that noise spectrum is quite normal an in no way elevated at HF as the images suggested that Petr showed.
Did you by the way also measured the noise spectrum in the same screen setting but without or with much lower level multitones.
If so, we can close this discussion.
I don’t care what happens above 20Khz as long as it has no repercussions on the audible frequencies.
And this multitone test could have given a clue.
But so far no cigar.
Hans
Measurement is limited by sound card noise floor . I can measure it tomorow, without input signal,with same settings as before. But nothing "special" will happen.
multiton-noise
Что такое разрешающая способность ? Форум Sound Space
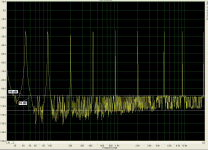
the measurement results show that the noise on a multitone signal has risen by almost 20 dB
Что такое разрешающая способность ? Форум Sound Space
the measurement results show that the noise on a multitone signal has risen by almost 20 dB
Attachments
Onset of peak limitation somewhere in the chain, generator, DUT, sound card input .. Multitone has a high crest factor, peak values are high compared to discrete tones. You have to lower signal few dB. The signal in the time domain must also be monitored for control.
In other words, the error is somewhere between the chair and the keyboard 😉
look examples
In other words, the error is somewhere between the chair and the keyboard 😉
look examples
Attachments

Last edited:
Good points. It is not easy to interpret the results from a multitone.
If you read the AP app note, they carefully select the frequencies and phases of the test signal, together with the FFT settings. The aim is to make sure that all harmonics fall in discrete FFT bins, so they can be measured individually.
Also, they make sure there are FFT bins where no fundamental or harmonic falls. These 'empty' bins can then be used to measure the noise in the presence of signal.
Jan
Gotta love it. BV posts a pretty blameless multitone result and Petr ignores it and posts a rubbish one to prove...nothing!
BV, this is an absolutely meaningless test, since all intermodes coincide with useful signals and therefore are not reflected or visible.
I gave a link to the correct test, follow the link and learn
????? ????????? ????????? ?????????? ?????????
? ????? - ??? ????????? ????????? - ???????? 23
I gave a link to the correct test, follow the link and learn
????? ????????? ????????? ?????????? ?????????
? ????? - ??? ????????? ????????? - ???????? 23
Last edited:
Gotta love it. BV posts a pretty blameless multitone result and Petr ignores it and posts a rubbish one to prove...nothing!
OTOH, that test shows the intermod and harmonics at the same freqs as the signal, and thus are hard to see. Petr has a point there.
I tried to explain how a proper multitone test needs to be structured so that all the harmonics as well as the noise can be seen separately.
Jan
That seems OK indeed Bill. Is that one of Tomc's designs?
Also, my comment to you was incorrect; BV's multitone is indeed pretty good, it was Petr's that looked bad designed.
Sorry for the confusion.
Jan
Also, my comment to you was incorrect; BV's multitone is indeed pretty good, it was Petr's that looked bad designed.
Sorry for the confusion.
Jan
Last edited:
Yes that is Tom's Mod86 (which is the amplifier I chose to build as a baseline reference). My Stochinos need a complete rebuild.

Petr, could you for once and for all explain what you are showing and why, where to look and what conclusions can be drawn because ....
Hans
Hans
Multitones used in measurements according ARTA manual:
For amplifier measurement I used wideband range signal , for two later examples speech range signal. It is absolutelly correct measurement.Wideband range - 1/3 octave spaced sine signals from 20Δf to fs/2. Crest factor 12 ± 1dB
Speech range - Linearly spaced sine signals from 100Hz to 500Hz, plus 1/3 octave spaced sine signals from 500Hz to 8kHz. Phases optimized for crest factor 10 ± 1dB.
..All multitone components are generated so that each sine frequency coincides with a frequency of DFT bins. That is why; in analyzing the response to the multitone we do not need to apply the signal windowing.
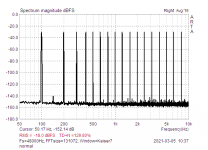
billshurv, your test is as bad as the previous test with frequencies over 1 kHz. This multitone has 30 frequencies. The more frequencies the lower their levels. The lower the levels of the RF components of the signal, the less the likelihood of intermodulation and velocity distortion.
The frequencies are extremely poorly chosen, most of the first order intermodes (having the maximum level) fall on the multitone frequencies. For example, 15 kHz - 12.5 kHz = 2.5 kHz; 15 kHz - 10 kHz = 5 kHz; 12.5 kHz - 10 kHz = 2.5 kHz; 10 kHz - 8 kHz = 2 kHz; 8 kHz - 6.5 kHz = 1.5 kHz; you can count in the reverse order: 10 + 5 = 15; 10 + 2.5 = 12.5; 12.5 + 2.5 = 15; 8 + 2 = 10 and so on ...
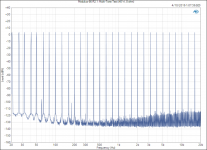
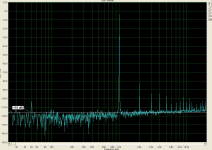
Hans, I don't understand what you don't understand in the tests. Here are two tests: a single sine test and a multitone test. On multitone, the noise level went up by 18 dB. And this is with a bad sound card. Some cards have an intrinsic noise level of minus 140 ... 160 dB, then the difference is seen more clearly.
The frequencies are extremely poorly chosen, most of the first order intermodes (having the maximum level) fall on the multitone frequencies. For example, 15 kHz - 12.5 kHz = 2.5 kHz; 15 kHz - 10 kHz = 5 kHz; 12.5 kHz - 10 kHz = 2.5 kHz; 10 kHz - 8 kHz = 2 kHz; 8 kHz - 6.5 kHz = 1.5 kHz; you can count in the reverse order: 10 + 5 = 15; 10 + 2.5 = 12.5; 12.5 + 2.5 = 15; 8 + 2 = 10 and so on ...
Hans, I don't understand what you don't understand in the tests. Here are two tests: a single sine test and a multitone test. On multitone, the noise level went up by 18 dB. And this is with a bad sound card. Some cards have an intrinsic noise level of minus 140 ... 160 dB, then the difference is seen more clearly.
Attachments
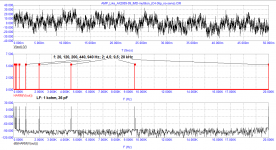
So use simple CCIF, 19+20kHz. Or use e.g.50+51kHz and look for product at 1kHz.The more frequencies the lower their levels. The lower the levels of the RF components of the signal, the less the likelihood of intermodulation and velocity distortion.
Petr,
yes those last images are almost clear but the second image does not show the noise well enough.
What were the exact frequencies, what was the used frequency bin width and how many spectra were averaged ?
And I still have no answer to #275.
The musatov link that you gave is not available.
You cannot say that a sound cards has a noise levels of -160dB.
Starting somewhere at -120dB for a 24bit A/D, it depends on the width of the used filter bin.
The narrower the less noise according to a square law and always to be followed by averaging spectra in order to flatten the noise to its average level.
In this multitone test we have to be able to discriminate noise from IM products,
because your thesis is that noise will increase because of “speed errors”.
So please give the frequencies for the multitone test and the filter bin width.
Hans
Hans, I don't understand what you don't understand in the tests.
It is not just Hans, it is many of us.
There is nothing to understand in your post. You just throw up two graphs, and say: 'See, graph 2 is better than graph 1'.
There is no description of what the test is, what are the signal levels, what kind of equipment is tested, what is the test setup, under which conditions, what are the differences, etc, etc.
You do that all the time and the result is that nobody knows what you are talking about, and you are wasting your own time as well as our time.
Jan
- Home
- Amplifiers
- Solid State
- Musings on amp design... a thread split