You and your normalized plots 😉.
😀 😀 😀
If you could send me the files I can create different patterns with VACS. I can normalize it to 0° oder any other angle you want. Or to "y max amplitude", if you don't want to equalize dips at 0°. It is very interesting to see how different normalizing settings affect the plot. 🙂
High praise Nate, congratulations on a successful build.
@ Earl, is your plot recommending a listening angle and target response or have you just shown the data as is?
The plot on top is at 20 degrees, which Nate said was his target. In the interactive plot that will be shown on my website shortly, one can look at any angle.
I don't understand.
Looks like Earl's data and ARTA's interpretation are fairly close. Earl's PolarMap shows the pattern a bit wider than ARTA but I suppose that's due to the way the interpolation is handled as well as the avg 0dB used?
It's mostly the choice of 0 dB. In the web app this can be adjusted if you want so that a closer match can be had.
Ok, so answer me this: If one takes Nate's response, which is optimized to be flat along the 20 degree angle, and normalizes along that same angle, what exactly will actually change in the plot?
I'm going to assume they want to see it normalized to 0°. This discussion has been had before........quite possibly in one of my threads 🙄. I'll say that I don't see any need for normalizing to 0° but it's easy to do so here you go. I could see normalizing an un-eq'd, raw response to my design axis if I wanted to look at the contour plot without going through the process of eq'ing and re-taking the data.
Attachments

It's mostly the choice of 0 dB. In the web app this can be adjusted if you want so that a closer match can be had.
What's the point in allowing the user to offset the response? Playing with your NS-15 data I offset +3dB. Doing so doesn't change the -6dB reference so it looks like the pattern is more like 110° (rather than 90°). When I went to change it I thought that it would offset the 0dB reference, rather than the speaker's response 😕. That said it appears what you've chosen for 0dB tracks 22° very well (your design axis?) but it also could be an average level for the 0° curve.
Nate - the point was to allow for a better comparison with other software that may use a different 0 dB reference.
I don't follow your other comment. Yes, changing the 0 dB reference does change the response by shifting it up or down. That's what changing the reference means.
Yes 22 degrees is what I design to.
I can't recall the exact method of setting the 0 dB point, but it is an average over some band of frequencies - I think on the 0 degree axis.
Normalizing an uneq'd response makes some sense, but arbitrarily picking 0 degree to normalize a speaker optimized to some other axis makes no sense.
I don't follow your other comment. Yes, changing the 0 dB reference does change the response by shifting it up or down. That's what changing the reference means.
Thinking about it more I'm not sure what I was driving at there either! Makes sense now......
PS - and yes, I have also noted that the choice of dB reference will alter the -6 dB beam-width (the reason for the reference level adjustment.) This will happen more or less depending on how uniform the response is across angles and frequency. To me, comparing beam widths accurately means standardizing on a means for determining the reference level. Its a no-brainer at a single frequency, but a real problem when one is looking at a broad band device.
And don't get me started on how much this gets screwed up when the data is normalized!!
And don't get me started on how much this gets screwed up when the data is normalized!!
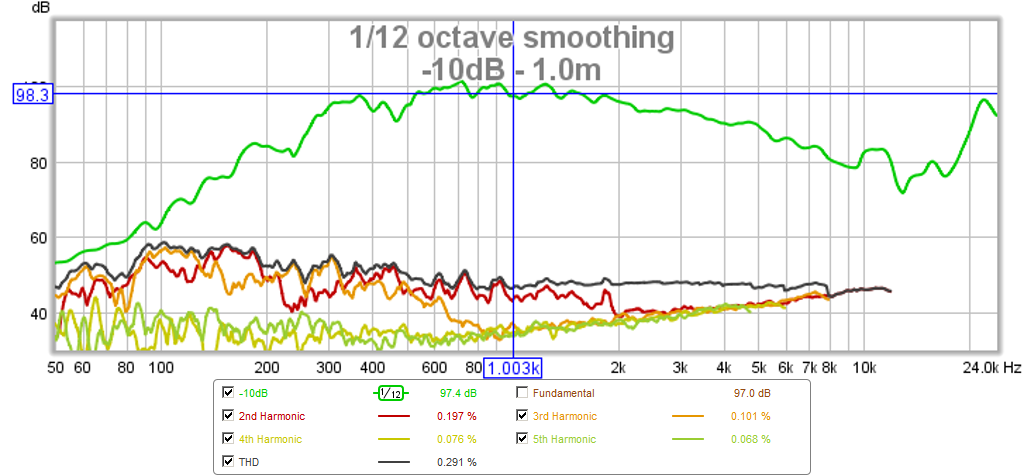
Micro Trynergy with similar mouth size as horn in this thread and 2in full range driver gets surprisingly high sensitivity and bandwidth. Still in progress as no bass ports yet - but looks very promising. Mouth dimensions are about 13in wide x 8.5in high x 11in deep. Single Tang Band paper cone full range W2-852SH driver.
http://www.diyaudio.com/forums/full...l-range-tractrix-synergy-108.html#post4544312
This was measured at 0.7v and 1m (-10dB down from 2.83v):
http://www.diyaudio.com/forums/full...l-range-tractrix-synergy-108.html#post4544312
This was measured at 0.7v and 1m (-10dB down from 2.83v):
Last edited:
Haha, I'm not sure they'll appreciate the increased directivity.New neighbors to the east...........thought I'd say hi.
Nice results Nate.
Thanks for the on axis normalized plot. The goal with that is to get an idea of directivity relative to the 0 axis. For me, it says something. Looking at normalized and original helps give a clearer picture. 
Pano - the more I look at the different plots and think about it I can see how they are both useful considering how much variance there is at 0deg on my wg. This falls in with my discussion with Earl a few days ago as the 0dB average can make quite a difference in the displayed plot and I'm not quite sure how to reconcile that with reality. Of course a device with less variance at all angles would be better and I'm going to try to improve that.
Allen - I don't follow......what is it that you see? I *do* plan to redo the eq, but not to any certain axis. This speaker is really used as a pa speaker in my basement gym/workshop so the coverage area is fairly wide. I'll re-eq to an average over the listening area.
Allen - I don't follow......what is it that you see? I *do* plan to redo the eq, but not to any certain axis. This speaker is really used as a pa speaker in my basement gym/workshop so the coverage area is fairly wide. I'll re-eq to an average over the listening area.
Micro Trynergy with similar mouth size as horn in this thread and 2in full range driver gets surprisingly high sensitivity and bandwidth. Still in progress as no bass ports yet - but looks very promising. Mouth dimensions are about 13in wide x 8.5in high x 11in deep. Single Tang Band paper cone full range W2-852SH driver.
http://www.diyaudio.com/forums/full...l-range-tractrix-synergy-108.html#post4544312
This was measured at 0.7v and 1m (-10dB down from 2.83v):
You must have Umik mic?
distortion rise to topend looks similar when juhazi visit me with his Umik...
- Home
- Loudspeakers
- Multi-Way
- Mini-Synergy Horn Experiment