I had to rescale the level for every curve in REW - it seems Holm normalizes the level of the impulse peak on export. Tedius!
It doesn't do that for me, otherwise the data would be useless! You may have it set to do that, but I don't think that it is the default.
If the impulses are normalized then the polars that I plot will be wrong and should be obvious. Think about it - normalize at 180 degrees to the same as 0 degrees would make a virtually Omni response. I can assure you that in all my data set the 180 curve is at least 10 dB below the 0 curve.
When you export an impulse there is a Normalize checkbox in HOLM. There isn't AFAIK for exporting FR as a text file. If you are exporting the impulse, don't check the Normalize to 0 box.
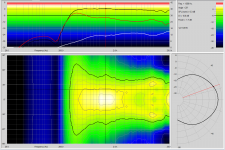
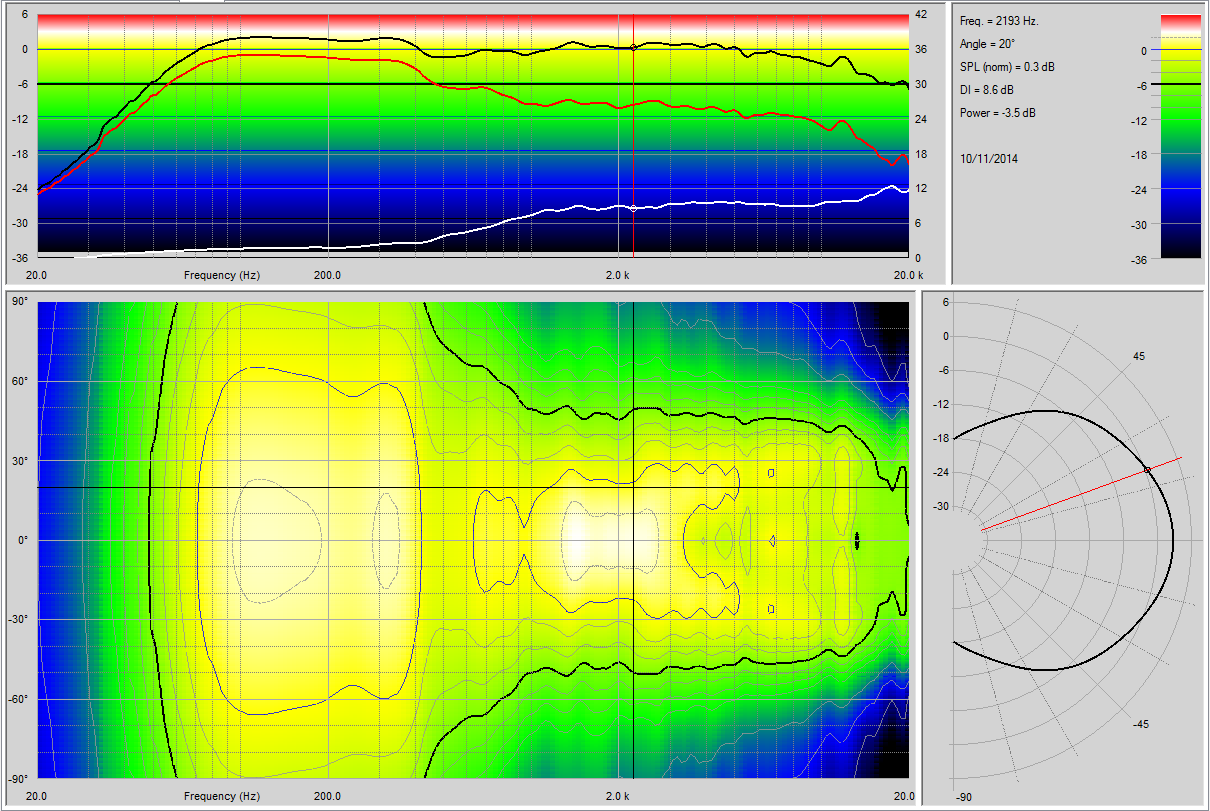
Looks good. Very consistent out to about 45 degs? Then the highs drop.
Looks good. Very consistent out to about 45 degs? Then the highs drop.
Bill - only in mono as this is the only extra wg like this that I have. I'm quite tempted to "synergize" the waveguides in my main system but that's quite a job for an unheated garage in December and I don't have the mid ports/chambers sorted yet. Tbh I haven't really done any listening since I reworked the xo a few days ago.
Earl - Pano is right about the normalize option. Left unchecked the IRs export just fine. I thought it was strange that the fr levels were fine in Holm but basically flipped in REW which is why I figured it was a Holm export setting.
I got the horizontal contour plot put together last night as well as the vertical. The vertical response ain't pretty......hopefully I'll have time to get those up tonight.
No it's correct.....I wouldn't have put it up if I didn't think so. What was screwed up was exporting individual IRs so I could plot it in ARTA but I got that squared away and it looks fine.
The file is not correct as it starts at point #200 and needs to start more like point -200. From what I see the original impulse is completely missed in the export as I would expect it would be at sample #200. You should be able to easily fix this by just opening the Holm data file and re-exporting the data from -100 to 4900. This is what I always use.
The data is sampled at 48000, which is not what I use (44100), but that error (which is small) may be more easily corrected on my end. You could also send me the complete Holm file and I can make all these corrections.
The data is sampled at 48000, which is not what I use (44100), but that error (which is small) may be more easily corrected on my end. You could also send me the complete Holm file and I can make all these corrections.
Ok sorry about that let's try this again. Here's the export. If you want/need the full file set I'll probably have to email it to you as it's just a tad too big for an upload here.
Attachments
Last edited:
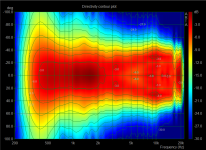
Here I'll show the vertical response, measured on the "top" half of the wg where one of the mid ports is on the same plane as the cd exit and the mic. A little background here: http://www.diyaudio.com/forums/multi-way/258674-diy-18-elliptical-waveguide.html#post4085114. In that post I show the horiz and vert response of this wg without the mid taps. Earl points out there that the ripples seen in the vertical response are edge diffraction, which makes sense to me. I believe what I'm seeing here is the edge diffraction from the mouth with diffraction off the port falling into the same 1-4khz region. Not good, but not terrible either. I think a larger wg with a more suitable mouth roundover would help take care of the edge diffraction then maybe the port diffraction wouldn't look so drastic. Sound reasonable?
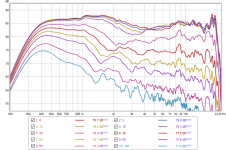
Note that there's no 20° curve.........I don't normally work with Holm and I must have saved over it with my next curve and kept going. Doh! Due to that I won't post a contour plot as I don't think it will be as accurate with the missing curve. Idk......maybe close enough?
I should have measured the other "side" of the wg in the vertical but I was getting cold and had other stuff to do. I'll do it indoors though, and I'm curious if the foam will have any effect here.
Attachments
I'd assume this would put the port 'disruption' closer in line with the direct and so lessen the time delay of issues direct from that one port. Still there probably isn't much room to guess.Here I'll show the vertical response, measured on the "top" half of the wg where one of the mid ports is on the same plane as the cd exit and the mic.
One of the disadvantages to DIYing an elliptical horn IMO is the compromise that a flat baffle termination represents, I mean to say these things are non-axisymetrical in every aspect.Earl points out there that the ripples seen in the vertical response are edge diffraction, which makes sense to me.
Too easy to do, as it is to look at the pictures before reading 😀Note that there's no 20° curve.........I don't normally work with Holm and I must have saved over it with my next curve and kept going.
Looking forward to seeing the processed data..

High praise Nate, congratulations on a successful build.
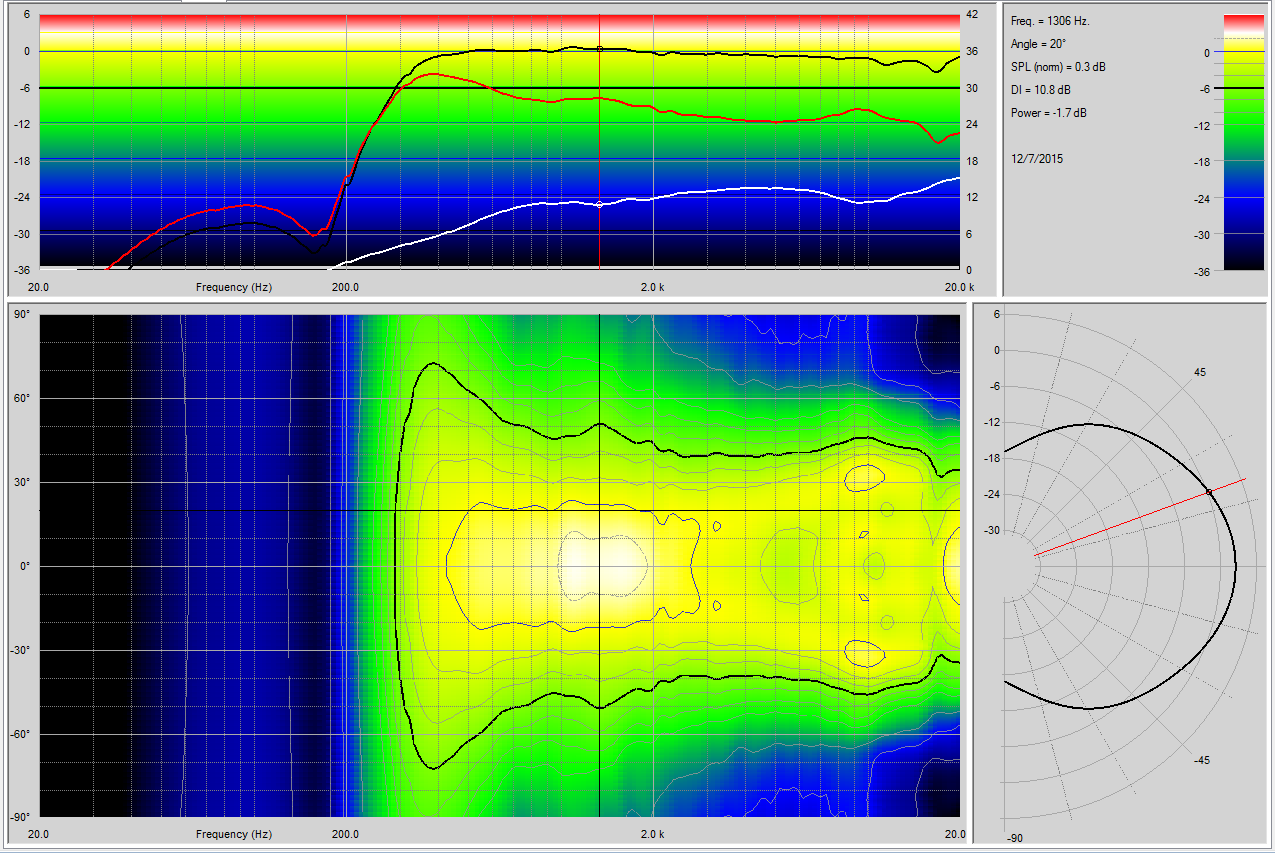
@ Earl, is your plot recommending a listening angle and target response or have you just shown the data as is?
@ Earl, is your plot recommending a listening angle and target response or have you just shown the data as is?
Wow, look how low the pattern control goes. Congrats Nate.
Does the step and phase response look as good in REW?
Does the step and phase response look as good in REW?
Holy Guacamole Nateman!!! Most impressive
Sir Dr. Geddes outstanding NS15!!!
http://gedlee.azurewebsites.net/Loudspeakers/NS15.aspx
Sir Dr. Geddes outstanding NS15!!!
http://gedlee.azurewebsites.net/Loudspeakers/NS15.aspx
Last edited:
Thanks Earl and thanks for the comments guys it does look quite good. Looks like Earl's data and ARTA's interpretation are fairly close. Earl's PolarMap shows the pattern a bit wider than ARTA but I suppose that's due to the way the interpolation is handled as well as the avg 0dB used? Let's not get too excited though........any comments other than Allen on the vertical response?
The phase was posted last week on the 4th and is the xo used in the data I sent Earl. The phase, impulse, and step are goofed up due to the roll-off of the mid range as well as the 2nd order hpf I have at 250hz.
You and your normalized plots 😉. I doubt Earl will do so but I can post a normalized plot from ARTA. I'll try to remember later.
Wow, look how low the pattern control goes. Congrats Nate.
Does the step and phase response look as good in REW?
The phase was posted last week on the 4th and is the xo used in the data I sent Earl. The phase, impulse, and step are goofed up due to the roll-off of the mid range as well as the 2nd order hpf I have at 250hz.
Is there a normalized version of the plot? 😉
You and your normalized plots 😉. I doubt Earl will do so but I can post a normalized plot from ARTA. I'll try to remember later.
- Home
- Loudspeakers
- Multi-Way
- Mini-Synergy Horn Experiment