Dear all, I think I've reached to understand the point with my absolute phase issue in LTSpice. Each time the signal goes through a filter, it adds some phase shift but when the phase is wrapped, it is coherent.
So I've change my passive with lamp buffer lag compensator by an active one and I think it gave me sufficient phase margin at low frequency. I will have to use the unused filter stage on EVE board to implement it.
The simulated bandwidth with AD7066 is quite large but I will have a minidsp in active setup in front of that to limit from 35 to 220 Hz (with an active full range speaker on top).
What do you think about the curves and schematic, do you think I have to adapt something ?
Attachments

Am I correct in understanding you have simmed the Eve circuit connected to the TPA and the TPA loaded by the equivalent circuit of the 7066?
I have problems interpreting the graphs of the OLTF: these are overly busy to put it mildly.
What does the transfer function of the equivalent circuit of just the 7066 look like?
I have problems interpreting the graphs of the OLTF: these are overly busy to put it mildly.
What does the transfer function of the equivalent circuit of just the 7066 look like?
Dear all,
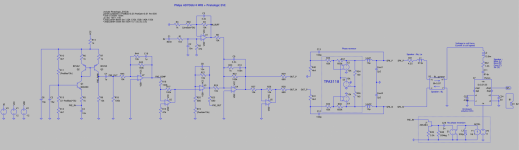
I've reworked a lot to understand deeper into details the system. I've put a simplified modelling of the amplifier to be more generic (parametrizable gain, input impedance and first order low pass filter) and usable for everyone. In this way the input DC blocking capacitor can be modelled to see the influence of the feedback loop stability.
The speaker model is still the same and tunable for every speaker. The PXE sensor is (I think close enough) the one from Philips AD7066. I've taken the worst case (parasitic capacitor and resistances values) to be sure about the close loop stability. Can anybody confirm the values realistic ?
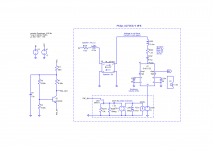
Regarding EVE board, I think the original pxe gain and low pass filter stage from Chriscam is more acting as a shelf filter than a low pass, right ? The issue I think is that the shelf frequency and bandwidth varies with the gain setting. I've added what I've called "PXE filter" into the schematic to separate PXE gain from filtering. In this way I can also compensate the low pole of PXE sensor.
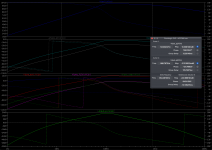
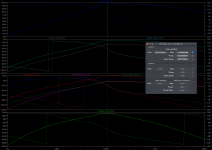
Direct speaker transfer function - 2D : is the frequency response of the speaker and PXE sensor with the amplifier supplied directly by the signal.
Feed-forward transfer function - 2D : is the frequency response with the signal going through the line buffer, the loop mixer and the amplifier.
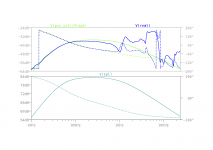
Open loop transfer function - 2D : is the gain over frequency of the complete loop including feedback (loop broken from EVE out. Signal entering amplifier, going though all including PXE complete path, outing at OUT_P). The maximum feedback gain is 16dB. The phase margins are quite confortable thanks to the PXE compensator.
Closed-loop transfer function - 2D : is the frequency response of the result. Very nice ! 15 to 1kHz at -3dB. With active filter at the input of EVE board to limit low and high extension, it will be perfect I hope.
Please note that all the figures have been traced with different IN signal amplitudes (100mV for open loop figures, 2.5V for closed loop in order to evaluate the amplifier amplitude).
I've reworked a lot to understand deeper into details the system. I've put a simplified modelling of the amplifier to be more generic (parametrizable gain, input impedance and first order low pass filter) and usable for everyone. In this way the input DC blocking capacitor can be modelled to see the influence of the feedback loop stability.
The speaker model is still the same and tunable for every speaker. The PXE sensor is (I think close enough) the one from Philips AD7066. I've taken the worst case (parasitic capacitor and resistances values) to be sure about the close loop stability. Can anybody confirm the values realistic ?
Regarding EVE board, I think the original pxe gain and low pass filter stage from Chriscam is more acting as a shelf filter than a low pass, right ? The issue I think is that the shelf frequency and bandwidth varies with the gain setting. I've added what I've called "PXE filter" into the schematic to separate PXE gain from filtering. In this way I can also compensate the low pole of PXE sensor.
Direct speaker transfer function - 2D : is the frequency response of the speaker and PXE sensor with the amplifier supplied directly by the signal.
Feed-forward transfer function - 2D : is the frequency response with the signal going through the line buffer, the loop mixer and the amplifier.
Open loop transfer function - 2D : is the gain over frequency of the complete loop including feedback (loop broken from EVE out. Signal entering amplifier, going though all including PXE complete path, outing at OUT_P). The maximum feedback gain is 16dB. The phase margins are quite confortable thanks to the PXE compensator.
Closed-loop transfer function - 2D : is the frequency response of the result. Very nice ! 15 to 1kHz at -3dB. With active filter at the input of EVE board to limit low and high extension, it will be perfect I hope.
Please note that all the figures have been traced with different IN signal amplitudes (100mV for open loop figures, 2.5V for closed loop in order to evaluate the amplifier amplitude).
Attachments
-
Piratelogic EVE + Philips AD7066 - 2D - schematic.pdf125.3 KB · Views: 233
-
Direct speaker transfer function - 2D.pdf157.7 KB · Views: 138
-
Feed-forward transfer function - 2D.pdf160.2 KB · Views: 113
-
Open loop transfer function - 2D.pdf191.8 KB · Views: 133
-
Closed-loop transfer function - 2D.pdf159.4 KB · Views: 126
-
Piratelogic EVE + Philips AD7066.zip711.3 KB · Views: 110

I think it could help people if I can update the LTSpice schematic with complete Piratelogic system.
Chriscam, could you please provide information to update the PXE sensor section according to Starbass sensors ? I think we need, parasitic capacitance of sensor, polarization resistance values, JFET model and global sensitivity in mV/G for at least one or two frequencies ?
Chriscam, could you please provide information to update the PXE sensor section according to Starbass sensors ? I think we need, parasitic capacitance of sensor, polarization resistance values, JFET model and global sensitivity in mV/G for at least one or two frequencies ?
Now your plots look fine. In your measured closed loop transfer function, you most like will find some peaking around 14 Hz and 1.2 Khz, which the sim does not show, because the phase margin is rather small at the frequencies@unity gain. See the picture from post 148: I did not get that at first, but Bolserst was kind enough to explain the issue. But you may also encounter another unpleasant surprise, and that is the measurements of the accelerometer-in-woofer-in-box does behave a bit more erratic around 1 a 1.5Khz than the textbook ideal or measured speaker SPL: the accelerometer tends to pick up all kinds of voice-coil anomalies or cone backwaves.
Attachments
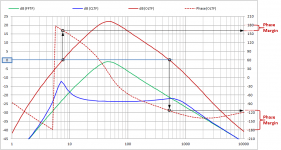
In my case the phase margin is 60° at 22Hz (0dB) and 68° at 582Hz (0dB), I hope it will be sufficient to avoid so much peak in real life as you mentionned !
Even in simulation we can notice those peaks when the phase margin is reduced at both ends, it is tricky to have something flat.
I hope that the Philips PXE sensor will be not so much noisy close to the (hard) cone breakup of AD7066 ! Do you have experience on that speaker ? 582Hz seems far from the cone breakup at 1400Hz, so will see.
No (recent) experience with the 7066. What is your intended application: just woofer in 3 way?
In case you have one: start with measuring the in-box piezo output transfer function. Then you can sim the loop with real data.
In case you have one: start with measuring the in-box piezo output transfer function. Then you can sim the loop with real data.
It will be a woofer in 2 way with a wide band speaker on top (220-20000Hz).
Thanks, it's a good idea to measure the real transfer function. I think I have to polarise the JFET at 5.4V as the original Philips to measure the sensor, do you have a simpler/quicker way to do this ?
Thanks, it's a good idea to measure the real transfer function. I think I have to polarise the JFET at 5.4V as the original Philips to measure the sensor, do you have a simpler/quicker way to do this ?
I built the current mirror from the Chriscam Eve board and fed the output to the mic input of my Focusrite. Then my project got stuck due to lack of time and still is.... Although I could have used some more gain, the setup worked.
This is the measurement of 17 cm midwoofer (in a 15 liter enclosure) kindly equipped with an accelerometer by ChrisCam. There are three issues to deal with:
A serious leak, badly affecting the phase lead
A surround issue at 950Hz, amplified by the accelerometer
A piezo resonance peak around 6-6,5kHz
Attachments

The 8066 is bigger than the 7066 but yes its impressive, what's a big breakup amplification !
I will follow your idea to measure my 7066 in real in order to include the pxe signature into my simulation.
I will follow your idea to measure my 7066 in real in order to include the pxe signature into my simulation.
Distortion and transient performance are the unique benefits of MFB (lots of ways of getting flat FR, eh). That's the plots I'd like to see.Keenly following your 7066 measurements! If you could post the measurement -including phase!....
B.
For sure, there're lot of ways to get flat FR. I use to play only with active crossover setup and it is quite easy to equalize a woofer (through DSP or convolution). As you, the value which is I think very interesting into MFB is the potential improvement on distorsion and transient figures. That's why I want to test that (especially for small woofer which are prone to distorsion with large necessary excursions).
First step is to measure the AD7066 in free air conditions to get PXE datas in order to improve the EVE board tuning by simulation before built it. This step is necessary to obtain the highest feeback factor possible with stability.
Then (but far later), when I will build the speaker, yes it will be very interesting to mesure the AD7066 without feedback but with EQ through miniDSP (same FR target than with feedback) and to compare it with feedback. We will see what will be the improvement in distorsion and transient !
Dear all, I've made measurements of my two AD7066 speakers ! First of all, the two sensors works correctly.............................................
 Moderator Edit... Please see post #277 for correct details.
Moderator Edit... Please see post #277 for correct details.
Last edited by a moderator:
I'm sure your post is very clear to you. But to anybody who doesn't have any idea what "PXE_OUT/SPK for each AD7066 (there are quite close !)" means, it means nothing at all. None of it. Unless you expect all readers to be as deeply immersed in every past post as you are.
Just explain post each plot and explain in words what you are measuring and what conclusions you think we ought to be seeing.
BTW, just post the plot images because many of us really dislike downloading and opening attachments from unknown persons.
Thanks.
B.
Just explain post each plot and explain in words what you are measuring and what conclusions you think we ought to be seeing.
BTW, just post the plot images because many of us really dislike downloading and opening attachments from unknown persons.
Thanks.
B.
I can't edit my post #275 (or I didn't find how to do that) so I repost there with modifications.
Dear all, I've made measurements of my two AD7066 (let's call them A and B) speakers ! First of all, the two sensors works correctly.
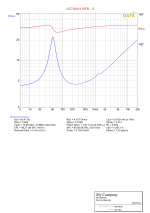
I've performed some times ago the Thiele Small parameters with DATS. See the attached files now in PNG for those interested by that.
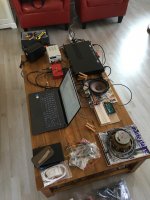
This week-end I wanted to have the PXE sensor response over frequency. I've connected the output of my Focusrite Scarlett through a T-Amp amplifier to supply the speaker with 0.6Vrms. The amplifier input was connected to the line input of the Focusrite with the gain set to have the same level as the digital output level (-10 dB).
In parallel I have built a small polarisation stage as in attachement to measure the PXE sensor. The output signal of this stage will be called PXE_OUT. The signal applied to the speaker from amplifier will be called IN.
Two measurement have been performed for each speaker. First sweep with input 1 and 2 of Focusrite connected to speaker (ie. amplifier output), line 2 acts as the loopback for REW. Second sweep with input 1 connected to PXE_OUT of polarisation stage and input 1 connected to speaker for loopback.
Then I've made with REW arithmetic (PXE_OUT/IN) for each AD7066. The resulting curve gives the response of PXE signal through stage sized with the signal applied to the speaker. Both curves were very close so I've made the vector average of both to have a mean equivalent speaker as the Thiele Small parameters I use in simulation.
Find in attachement the DATS curves of both AD7066, the polarisation circuit I've used for the measurement, the PXE sensor frequency response of equivalent average and the text FR data (for those interested by that).
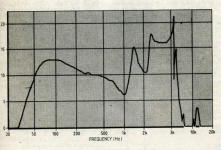
The attached curve gives an accurate view of the PXE sensor signal over frequency (but with the PXE stage given in LTSpice schematic) for an AD7066 MFB speaker. We can see that the cone breakup generates chaotic signal after 1kHz but I think we can deal with that. The next step is to update the LTSpice PXE sensor model to fit with those data !
Dear all, I've made measurements of my two AD7066 (let's call them A and B) speakers ! First of all, the two sensors works correctly.
I've performed some times ago the Thiele Small parameters with DATS. See the attached files now in PNG for those interested by that.
This week-end I wanted to have the PXE sensor response over frequency. I've connected the output of my Focusrite Scarlett through a T-Amp amplifier to supply the speaker with 0.6Vrms. The amplifier input was connected to the line input of the Focusrite with the gain set to have the same level as the digital output level (-10 dB).
In parallel I have built a small polarisation stage as in attachement to measure the PXE sensor. The output signal of this stage will be called PXE_OUT. The signal applied to the speaker from amplifier will be called IN.
Two measurement have been performed for each speaker. First sweep with input 1 and 2 of Focusrite connected to speaker (ie. amplifier output), line 2 acts as the loopback for REW. Second sweep with input 1 connected to PXE_OUT of polarisation stage and input 1 connected to speaker for loopback.
Then I've made with REW arithmetic (PXE_OUT/IN) for each AD7066. The resulting curve gives the response of PXE signal through stage sized with the signal applied to the speaker. Both curves were very close so I've made the vector average of both to have a mean equivalent speaker as the Thiele Small parameters I use in simulation.
Find in attachement the DATS curves of both AD7066, the polarisation circuit I've used for the measurement, the PXE sensor frequency response of equivalent average and the text FR data (for those interested by that).
The attached curve gives an accurate view of the PXE sensor signal over frequency (but with the PXE stage given in LTSpice schematic) for an AD7066 MFB speaker. We can see that the cone breakup generates chaotic signal after 1kHz but I think we can deal with that. The next step is to update the LTSpice PXE sensor model to fit with those data !
Attachments

You are moving faster in two weeks than most of us in two years. Congrats! Two observations:
a) Your measurements are in ULF suffering from the same problem I encounter in my apartment: the measurements should be clean and thus roll off slope uniform untill 5Hz. I suppose you are picking up rumble from a sub- rail- or motorway or some other source of infra sounds.
b) I see some cone-surround action and break ups similar to my own measurements.
One thing I forgot: for a proper sim the measurement must be in-box, not in free air. Raising Fo to Fobox will have major impact on low end phase, so for accurate simming you need the real data. Autrement, je vois le magazine Marie Claire joue un role tres important.
Thank you for your remarks Boden. I don't know why the ULF is not accurate, I live in country side, no sub, train or motorway and the two speakers shows the same else they have been measured with time interval. Maybe the fan from the laptop, or the signal to noise ratio at these frequencies (low amplifier, Focusrite and PXE gain) is an issue ?
Nevertheless it would not be a problem to correlate with the Spice model, when I put both together, they follow well at low frequency.
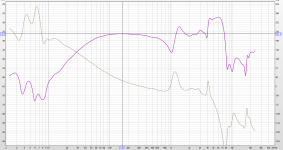
The cone breakup effect will be more challenging to modelize but I'm working on that. One interesting feedback from now is that the PXE gain is lower than expected, I have to reduce the inductance value which simulates the speed derivation to 220uH end to parasitic PXE capacitance to 1.4nF. As you can see in attachement the correlation is perfect up to 400Hz in phase but lower in gain due to cone breakup steps.
For sure the box have a strong impact but my goal is to update the PXE model according to this measurement and then to finalize the tuning of EVE board before solder it with the complete Spice model and the final box volume. The Spice speaker model is able to handle different box volumes and to simulate the effect on accelaration and F0, so I think it will be far sufficient.
Nevertheless it would not be a problem to correlate with the Spice model, when I put both together, they follow well at low frequency.
The cone breakup effect will be more challenging to modelize but I'm working on that. One interesting feedback from now is that the PXE gain is lower than expected, I have to reduce the inductance value which simulates the speed derivation to 220uH end to parasitic PXE capacitance to 1.4nF. As you can see in attachement the correlation is perfect up to 400Hz in phase but lower in gain due to cone breakup steps.
For sure the box have a strong impact but my goal is to update the PXE model according to this measurement and then to finalize the tuning of EVE board before solder it with the complete Spice model and the final box volume. The Spice speaker model is able to handle different box volumes and to simulate the effect on accelaration and F0, so I think it will be far sufficient.
Attachments
- Home
- Loudspeakers
- Subwoofers
- MFB for ACI SV12 Drivers using Piratelogic Electronics