That's quite good for a handheld meter.Well, the Fluke 87 is rated to 100 KHz I believe. So while not ruler flat, it won't be off by very much.
If one wants to go higher, the HP/Agilent/Keysight/Whatever-Name-This-Week 34401A bench top meter goes to about 800 kHz (-3 dB).
Tom

I have affordable UNI-T UT71 and it is rated up to 100kHz at ACV, but it goes reliably even higher.
Wondering if the issue might have to do with assumptions involved in converting average noise to RMS noise?...would really appreciate if somebody could point out where I'm going wrong...
I've droned on about this one example ad nauseam, but a little more stomach sickness probably isn't any worse.Other aspects, such as for example?
USB Common Mode Noise
The original E1DA Cosmos ADC had no USB isolation built in. When I first measured the distortion of a Topping D10 DAC with the Cosmos ADC, I was really confused. I got nowhere near the results of what's been published on the web. Yet, a battery powered 1 KHz oscillator from Victor tested just as expected. Bad DAC?
So, I started digging.
Generating the signal from one computer into the DAC and looking at the output on a second computer plugged into a different AC mains line connection gave roughly equally bad but qualitatively different awfulness.
Generating the signal from one computer into the DAC and looking at the output on a second laptop computer running on its internal battery but otherwise floating, gave the expected/desired results.
It seemed that there was a common mode loop.
I measured the CMRR of the input of the Cosmos ADC and it was a little more than 60 dB. Around the same time as I did this, another person (PMA, in fact) published his own CMRR measurements and they were very close to mine. Not enough to eliminate common mode generated garbage by itself.
So, I reasoned that there must be a common mode loop through the USB connections that converted into undesirable signals at the ADC input.
I then experimented with an ADUM4166 eval board and found that this fixed the issue. It broke the loop. So, I built a couple USB isolators using this chip and the problem was solved. (Later, Ivan began offering the ADCiso version, with USB isolation built in. That seemed like the perfect opportunity and justification to buy a new ADCiso with higher specs than my original Cosmos ADC.)
But, here's the thing. Trying these USB isolators in both my desktop computer system and the real sound system in the living room gave a definitely audible improvement in the sound quality of both. More than just audible - really substantial and repeatable. Good enough for me.
When you consider the CMRR at the input of most home audio gear, that shouldn't be surprising. I know that none of my gear has >60 dB CMRR. Not much does. Unbalanced inputs have pretty close to zero.
I expect that most people would clearly hear this. Yet, where do you see any of this discussed or shown? AP test gear has most impressive CMRR on the analog input side. So, these problems don't appear in AP based tests.
Full disclosure: I haven't measured the common mode currents in our home audio system. Too lazy and what's to prove? I have nothing to sell. Adding the USB isolator makes a performance improvement that both my wife and I approve of. That's the main test. Maybe one day in the winter when I'm bored, I'll get around to it.
OK, you could also infer that AC mains filters that knock down common mode currents would also be an improvement for the same reasons. I have found that I hear very similar sonic improvements. Same for basic AC-DC supplies that have high common mode rejection.
Have I measured this? Again - too lazy. I certainly could measure at the amplifier output with a laptop and the Cosmos ADCiso before and after spectra. But, who wants to jump into the inevitable arguments that would ensue if I showed my result? Not me. I'd rather build better gear and listen to the results.
This is but one example to answer your question. There are many others that haven't really been investigated, or at least the results haven't been made public. If I was an audio company, I'd keep quiet about these unless expounding on them gave me some advantage in the marketplace. Just let the results speak for themselves. (Side comment - my general observation has been that people who spend substantial money on home audio gear either rely on their own ears (!) or reviews for purchase decisions. They don't rely on specs and test results so much.)
Any analog cable interconnection of 2 different USB (non-isolated USB) devices is a big problem due to balancing HF and LF noise currents flowing through signal gnd. Anyone who tries to be serious in audio measurements must be aware of this fact. It may be partially improved by balanced interconnection. At best, with signal gnd connected only at DAC side and ADC side would measure only by means of 2 wires, +IN and -IN, relying on CMRR. This way it is possible to measure power amplifiers with negligible mains and USB packets related interference spectral lines. Any single-ended DAC - DUT - ADC interconnection with a signal ground loop must be avoided!!! In such case, USB isolator is a must. But they may not be completely compatible with the device and they may not allow for full device sampling rate.
Regarding USB isolators, I tried one that caused more problems than it fixed. There are a few posts about it starting at: https://www.diyaudio.com/community/threads/problematic-usb-isolator-unit.399247/post-7356655
BTW, now for my diy dacs I always run the dirty side of JL Sounds I2SoverUSB from a clean, isolated linear power supply (I2SoverUSB clean and dirty sides are galvanically isolated). Most people who try it seem find it sounds better that way.
BTW, now for my diy dacs I always run the dirty side of JL Sounds I2SoverUSB from a clean, isolated linear power supply (I2SoverUSB clean and dirty sides are galvanically isolated). Most people who try it seem find it sounds better that way.
Last edited:
Or, perhaps, it's because all of those plots have relative levels in their measurements. Generally, that's what people prefer to see for distortion measurements. As in, how many dB below the signal is the seventh harmonic. Or whatever.Wondering if the issue might have to do with assumptions involved in converting average noise to RMS noise?
If you want an absolute number for something, you need to know what the absolute reference is. In the case of most of the plots I posted, you'd need to know to know what 0 dBFS represents. For all you know, it could be 871 Volts. (It's not - it's 4.5 Vrms)
You likely won't be able to track that data down from most published test plots. So, you're stuck. If you can, it's better to do what PMA suggests and measure it yourself. In some published reviews that include measurements, they tell you what the SNR is, in what bandwidth, and relative to what level. From there it's easy enough to determine the noise density. Even there you'd be assuming a flat noise floor, which it often is not.
Regarding USB isolators, I tried one that caused more problems than it fixed.
Another issue with USB isolators is that not all of them can move data at any appreciable speed. Some are USB 1.1 Full Speed (11 Mbit/s) devices. That can be a problem if your sound card expects USB 2.0 (480 Mbit/s).
Tom
Regarding USB isolators, I tried one that caused more problems than it fixed. There are a few posts about it starting at: https://www.diyaudio.com/community/threads/problematic-usb-isolator-unit.399247/post-7356655
BTW, now I always run the dirty side of JL Sounds I2SoverUSB from a clean, isolated linear power supply. Most people who try it seem find it sounds better that way.
Well, perhaps, that could be the wrong USB isolator. They come in many flavors.
Another issue with USB isolators is that not all of them can move data at any appreciable speed. Some are USB 1.1 Full Speed (11 Mbit/s) devices. That can be a problem if your sound card expects USB 2.0 (480 Mbit/s).
Tom
Isolators based on the ADUM4166 (and some other ADUM parts) can easily do 480 Mbit/s. I think there's a TI device or two that does that, although they're based on a different technology. Some others, too, but I have no experience with them.
One more thing - you need to use isolated power for the "clean" side of these, too. Otherwise you just create a new ground loop. This can be done with a battery, or maybe a DC isolation system based around a TI SN6505 or SN6507, or something similar. Many, if not most, linear supplies aren't very isolated when it comes to common mode signals, and in fact very often modulate the existing unwanted common mode signals so that new common mode frequency components are added. 🤢
Last edited:
...that could be the wrong USB isolator...
Yes, just a "heads up" to be aware not all USB isolators are necessarily helpful.
It’s quite normal to get very large common more voltages across isolators - that’s exactly what they’re designed to deal with. The problem is those common mode voltages often couple into the receiver side through stray capacitances etc. To check this on your setup, just measure across the isolation barrier with your scope - you will surprised at the amount of wideband hash. To get around this, use the same outlet strip, keep cables tightly bundled and bond the chassis together.
Sure. Even then, for plain old white noise there is typically the assumption that it is gaussian white noise. Sometimes it isn't exactly gaussian. Depends on the physical process creating the noise. An interesting few words on the subject at: https://www.edge.org/response-detail/11715From there it's easy enough to determine the noise density. Even there you'd be assuming a flat noise floor, which it often is not.
EDIT: fixed link
Mark, what do you mean by 'average noise'? I'm assuming that REW (and Multitone) compute and graph amplitudes as proportional to square root of power. For both noise and sines that would be the RMS values. The time average over a true noise signal amplitude (as well as over a sine) should be close to zero (exactly zero if you average over integer periods of a periodic signal amplitude, which would happen if you choose the REW options to lock the generator frequencies to the FFT, and to generate periodic noise). The only time you'd get a non-zero average of the amplitude is if there is a DC offset.Wondering if the issue might have to do with assumptions involved in converting average noise to RMS noise?
So, why does the math not work? As I said, I assume it's some simple mistake I'm making, but where?
When one averages multiple spectral views, it appears to reduce noise. However, what it is really doing is averaging noise. IIRC, its a "boxcar" filter effect. Other than that, what is seen in a spectral view could be squared or not. If one uses a set of DSP routines to acquire a dataset, the perform an FFT on the dataset, then convert the output to polar form, then plot the magnitude value for each frequency, the result would be the integrated noise signal correlation with each bin frequency, integrated over the acquisition time of the FFT dataset. From there, values may be squared to represent noise power. If what we know is average noise per bin, and if what we want to know is RMS noise, then there is some assumption about the relationship between average and RMS values. That ratio is waveform dependent, and is related to crest factor....what do you mean by 'average noise'?
Anyway, I'm not exactly digging into your math verses what REW displays. I'm just thinking about what is going on at some level as noise is measured.
Last edited:
Yep. Many of the ISO parts from TI can do 480 kbit/s USB2. They even have some that go on the USB data lines instead of on the I2S lines.Isolators based on the ADUM4166 (and some other ADUM parts) can easily do 480 Mbit/s. I think there's a TI device or two that does that, although they're based on a different technology.
Many of the cheap USB isolators are transformer based and won't go much faster than USB1.1. So beware of which technology is used when you buy. That's my point.
Tom
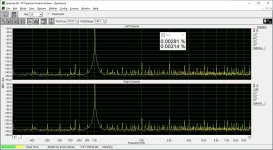
Results count, nothing else. Below an example of measurement “on the cheap” measuring system, USB DAC, USB ADC, one isolator, power amp.

Answering my own question:Question: to compare the noise floor in the plots above to other FFT graphs, I need to take into account the FFT bandwidth, the windowing function, and any averaging that might have been done, right?
[...]
So, what is the correction factor for the noise floor in the plots above by @CG ?
- On the 'usual' scales (not the normalized V/Sqrt(Hz) one) REW displays the noise amplitude spectral density * SQRT (sampling frequency/FFT length). For example, for 192kHz sampling frequency and a 1M FFT window, one would need to multiply the REW noise level with sqrt(1M/192k) or about 3.23, equivalent to adding 10.2 dB, to get the true noise amplitude spectral density in dB/SQRT(Hz).
- Averaging only reduces the apparent noise level if coherent averaging is done on the REW internal generator tone signal, with the generator locked to the FFT. I believe this is essentially the same effect as increasing the FFT width, where REW also knows the calibration of the input signal, and applies it to the vertical scale. Otherwise (non-coherent averaging and/or generator off) averaging will reduce the width and fluctuations of the noise trace, but not the level itself.
- The windowing function does change the displayed noise level; for example, selecting Blackman-Harris 4-term increases the displayed level on the V scale by a factor 1.4 over rectangular, in line with what the AP note says.
Plus, of course all the caveats mentioned by CG above and MarkW apply.
Last edited:
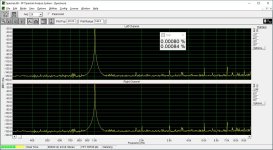
Back to my question, These are IM products, not noise, and they are not present on the Multitone plot even though everything up to the digital processing is the same?

You can tell they are IM products by the symmetry and discrete nature. This is what I usually see with these tests. Its quite good with the IM products all below -120 dBFS but the Multitone is too good to be real with zero IM. Especially weird since Multitone is an IM test.
Comparing noise is hard if they are not compared in a standardized way. Usually noise density at a frequency in rt/Hz. The window function has a significant impact and needs to be corrected for. Some software does. Spectral plots not in rt/Hz are useful for finding specific noise components but not for meaningful comparisons. However done "right" they make great ad copy.
- Home
- Design & Build
- Equipment & Tools
- Measuring Distortion on the Cheap