If your want to know precisely, sent the drivers for a Klippel scan😀. depending in cone size and dust cap/phase plug size, the interaction is complicated. Then you also have the radial and circular modes, etc. 😎Dr. Geddes (or anyone capable of giving an educated guess), could you just analyze this for a second? So what makes one woofer behave like this:

(this measurement was taken with the start of a crossover in place)
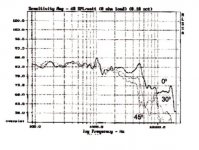
See how the first break up stays at roughly the same frequency.
and another behave like this:

The break up changes frequency with axis. The box is nearly identical, but the cone shape is drastically different. Both are paper cones, but the one on top is treated with some proprietary stuff, rubber surround (material unknown exactly) and has a concave dust cap. The second woofer is untreated, convex dust cap and cloth accordion surround.
Thanks,
Dan
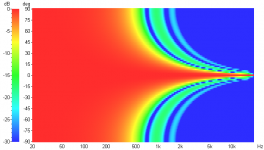
Right. Here's an LspCAD polar map of a perfect 300mm piston with no baffle effects. The peaks and nulls move lower in frequency as you move farther off axis.Thats simple polar response. The null move location with frequency. see why polar aspects of a loudspeaker design can get complicated.
Edit: oops that's a 300mm radius or 600mm diameter.
Attachments
Last edited:
gedlee - First off I want to thank you for your reply and input throughout this thread. On the case of subjectivity and objectivity - Are your objective personal trade offs better then another engineers personal trade offs? That seems like very subjective decision making.
Don't get me wrong, further study and objectivity is always required. But indeed it may never answer the question of selection, regardless of how objective any design can be (or how "experienced" the subjective listener might be regarding Hi Fidelity, and the trade offs that they are willing to live with).
Is that always true? There is commonly a change in peaks and nulls varying in frequency toward the upper limit of a drivers response as you move off axis. I have looked at far too many frequency response charts from different manufacturers to suggest otherwise. I'm probably just missing something, but I'm pretty sure this is a critical area of avoidance or control. This is probably where most manufactures fail to do a good job imo.
Also, if resonance did not change in frequency off axis, then that would disprove the doppler effect comming into play - which I do not think it does disprove at the moment.
The Leslie speaker for the Hammond B3 organ, leveraged that anomaly by spinning the speaker within the cabinet. While that may not be a fair or rational comparison, it still suggests to me that there is alot more going on with frequencies off axis than amplitude drop.
Don't get me wrong, further study and objectivity is always required. But indeed it may never answer the question of selection, regardless of how objective any design can be (or how "experienced" the subjective listener might be regarding Hi Fidelity, and the trade offs that they are willing to live with).
A resonance could not possibly change in frequency with angle. But diffraction or a reflection can and do. So that is most likely the situation.
Is that always true? There is commonly a change in peaks and nulls varying in frequency toward the upper limit of a drivers response as you move off axis. I have looked at far too many frequency response charts from different manufacturers to suggest otherwise. I'm probably just missing something, but I'm pretty sure this is a critical area of avoidance or control. This is probably where most manufactures fail to do a good job imo.
Also, if resonance did not change in frequency off axis, then that would disprove the doppler effect comming into play - which I do not think it does disprove at the moment.
The Leslie speaker for the Hammond B3 organ, leveraged that anomaly by spinning the speaker within the cabinet. While that may not be a fair or rational comparison, it still suggests to me that there is alot more going on with frequencies off axis than amplitude drop.
Right. Here's an LspCAD polar map of a perfect 300mm piston with no baffle effects. The peaks and nulls move lower in frequency as you move farther off axis.
Edit: oops that's a 300mm radius or 600mm diameter.
Ah- maybe this is helping me understand a little more. I'm trying to decipher whats happening with this. Is this an actual test or a simulation? Looks like the response peaks and dips do indeed change in frequency relative to axis measurement as I suspect, I just don't understand why.
Is that always true? There is commonly a change in peaks and nulls varying in frequency toward the upper limit of a drivers response as you move off axis.
Absolutely.
Think about it. Imagine two listeners; one on axis, one off axis. How could they hear two different resonances from the same source at the same time?
It's like two observers standing on the same inertial frame of reference getting two different speeds for the velocity of a photon of light.
If the driver resonates at 25 Hz, it does so because that is its mechanical resonance lies. It is also the point where the driver's impedance is highest. You can test the driver's impedance electrically with a function generator, small resistor, and a voltmeter. The resonance point will not change, even if you turn the driver 90°.
The doppler effect would require two different frequencies. The first would be a low frequency and the second a higher frequency. As the cone is moving in or out with the lower frequency it is also vibrating with the higher frequency. The cone's motion imparts a slight doppler effect on the higher frequency because it is moving back and forth. It's like the old train scenario, but instead of the train just passing you the train moves continuously toward you and then back away from you as it blows its horn.
So, the doppler shift is not static, but dynamic. That is, it does not impart a frequency shift in only one direction, but wobbles back and forth in frequency about the center frequency of the secondary tone at a rate of the fundamental tone's period. If you average all of the doppler shifts together (both positive and negative) they average to zero. Does that help answer your question?
Last edited:
Looks like the response peaks and dips do indeed change in frequency relative to axis measurement as I suspect, I just don't understand why.
The driver does not under go a resonance shift, but simply an amplitude change based on the angle you observe it. It only appears like a shift in frequency, but what you are seeing is the diffraction effect on the original wave.
I think I can explain this better like this. Imagine a driver which is the source of sound. That sound travels in all directions. Some of the wave travels along the edge of the driver and along the baffle. When it hits the baffle edge it scatters some of that signal out in all directions. Some of that is heard by the observer and competes with the original source from the driver. The phase of the two signal sources determine whither they add or subtract from each other and by how much.
If the point source (the driver) is considered the geometric origin, imagine the edge of the baffle is 12" away. The distance between the edge of the baffle and the driver origin is equal in distance from your ear. The ratio of those distances is 1 to 1 (1:1).
As you move to the side of that cabinet the ratio is no longer 1 to 1 because the baffle edge is now closer to your ear than the driver, so the time it takes for the two signals to reach your ears is different than it was when listening straight on-axis. That means the phase cancellation will also be different than it was when you were on-axis.
So, frequencies that were reinforced on-axis may be somewhat cancelled as you go off axis and that amount of reinforcement and cancellation changes based on the observer's angle.
Summing it up, as the angle of observation changes, so does the distance between the driver and the point where the diffraction happens on the baffle, which cause a change in the sum of the two waveform sources.
In the real word it is more complex than that because you have an infinite number of points where diffraction occurs along the baffle edge, the driver's cone, the driver's suspension, basket, and even the back edges of the cabinet. Sound continues to wrap around the cabinet producing secondary and tertiary diffraction radiation points. Modeling all that requires a lot of computational time.
Last edited:
The driver does not under go a resonance shift, but simply an amplitude change based on the angle you observe it. It only appears like a shift in frequency, but what you are seeing is the diffraction effect on the original wave.
Where I mentioned resonance I think I mis-communicated. I was referring to the off axis frequency response peaks, not the actual mechanical resonance peak. Sorry about that.
I think I can explain this better like this. Imagine a driver which is the source of sound. That sound travels in all directions. Some of the wave travels along the edge of the driver and along the baffle. When it hits the baffle edge it scatters some of that signal out in all directions. Some of that is heard by the observer and competes with the original source from the driver. The phase of the two signal sources determine whither they add or subtract from each other and by how much.
Ok. This I get, and I think your are giving me a needed re-fresher-thank you.
If the point source (the driver) is considered the geometric origin, imagine the edge of the baffle is 12" away. The distance between the edge of the baffle and the driver origin is equal in distance from your ear. The ratio of those distances is 1 to 1 (1:1).
As you move to the side of that cabinet the ratio is no longer 1 to 1 because the baffle edge is now closer to your ear than the driver, so the time it takes for the two signals to reach your ears is different than it was when listening straight on-axis. That means the phase cancellation will also be different than it was when you were on-axis.
So, frequencies that were reinforced on-axis may be somewhat cancelled as you go off axis and that amount of reinforcement and cancellation changes based on the observer's angle.
Summing it up, as the angle of observation changes, so does the distance between the driver and the point where the diffraction happens on the baffle, which cause a change in the sum of the two waveform sources.
In the real word it is more complex than that because you have an infinite number of points where diffraction occurs along the baffle edge, the driver's cone, the driver's suspension, basket, and even the back edges of the cabinet. Sound continues to wrap around the cabinet producing secondary and tertiary diffraction radiation points. Modeling all that requires a lot of computational time.
This is all fine. I'm still scratching my head a little on the previous comment on the Doppler effect summing to zero. I'm really not sure of it's importance and how it will effect the outcome of off axis behavior other then, as you say, the wobbling creates an effect that adds or subtracts. Maybe adding to more erratic of-axis behavior?
This is all fine. I'm still scratching my head a little on the previous comment on the Doppler effect summing to zero. I'm really not sure of it's importance and how it will effect the outcome of off axis behavior other then, as you say, the wobbling creates an effect that adds or subtracts. Maybe adding to more erratic of-axis behavior?
You can probably forget the doppler effect altogether. Most response curves are swept sine wavs, so at any one instant there is only one tone at a time.
On the case of subjectivity and objectivity - Are your objective personal trade offs better then another engineers personal trade offs?
There are of course always tradeoffs, but isn't it logical that the broader ones knowledge of the subject matter - psychoacoustics in this case - the more likely that the tradoffs that you make will be the right ones.
There is no significant doppler effect in a loudspeaker. It is barely measureable under ideal circumstances and deffinateky does not account for the kinds of things that you are talking about.
There are of course always tradeoffs, but isn't it logical that the broader ones knowledge of the subject matter - psychoacoustics in this case - the more likely that the tradoffs that you make will be the right ones.
I totally agree.
There is no significant doppler effect in a loudspeaker. It is barely measureable under ideal circumstances and deffinateky does not account for the kinds of things that you are talking about.
One less thing to worry about is a good thing. Thank you both.
The charts below are from a Morel MW164, as provided in their literature. First one is from the Parts-Express PDF, the other 2 are from Morels website (PDF) The phase and impulse data differences look bizarre to me. Other then that, the 5k response peak and the resonant frequency look close.
Sorry for the lousy resolution
Any feedback on this data? Another thing that is odd to me is the "blip" around 1k in the phase and impedance data.
Thank You
Attachments
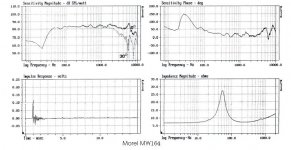
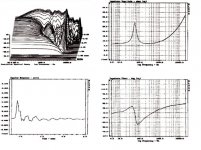
There is a resonance at about 1 kHz, which will cause the phase and impedance data to show this.
If your want to know precisely, sent the drivers for a Klippel scan😀. depending in cone size and dust cap/phase plug size, the interaction is complicated. Then you also have the radial and circular modes, etc. 😎
This is what is known. The real question is how do each of these factors effect the polar response esp in the break up region? I cannot get any real input on this other than the link below. This week I plan on doing some experiments for insight. Maybe that will lead me to better comprehension. It would just be nice to have an idea of how to pick a good woofer candidate for narrow directivity loudspeaker design. Hopefully I'll have some useful data in a few days.
http://www.loudsoft.com/\loudsoft\my files\ALMA Paper 2003.pdf
Thanks Soongsc,
Dan
The driver does not under go a resonance shift, but simply an amplitude change based on the angle you observe it. It only appears like a shift in frequency, but what you are seeing is the diffraction effect on the original wave.
I think I can explain this better like this. Imagine a driver which is the source of sound. That sound travels in all directions. Some of the wave travels along the edge of the driver and along the baffle. When it hits the baffle edge it scatters some of that signal out in all directions. Some of that is heard by the observer and competes with the original source from the driver. The phase of the two signal sources determine whither they add or subtract from each other and by how much.
If the point source (the driver) is considered the geometric origin, imagine the edge of the baffle is 12" away. The distance between the edge of the baffle and the driver origin is equal in distance from your ear. The ratio of those distances is 1 to 1 (1:1).
As you move to the side of that cabinet the ratio is no longer 1 to 1 because the baffle edge is now closer to your ear than the driver, so the time it takes for the two signals to reach your ears is different than it was when listening straight on-axis. That means the phase cancellation will also be different than it was when you were on-axis.
So, frequencies that were reinforced on-axis may be somewhat cancelled as you go off axis and that amount of reinforcement and cancellation changes based on the observer's angle.
Summing it up, as the angle of observation changes, so does the distance between the driver and the point where the diffraction happens on the baffle, which cause a change in the sum of the two waveform sources.
In the real word it is more complex than that because you have an infinite number of points where diffraction occurs along the baffle edge, the driver's cone, the driver's suspension, basket, and even the back edges of the cabinet. Sound continues to wrap around the cabinet producing secondary and tertiary diffraction radiation points. Modeling all that requires a lot of computational time.
That's a helpful explanation! Thank you very much.
Dan
Oh, I see why. This is only one part of the issue-- the one of most concern to me.Thats simple polar response. The null move location with frequency. see why polar aspects of a loudspeaker design can get complicated.
Notice how the first driver doesn't do that to the degree of the second one. What visible characteristics could be attributed to this--inverted dust cap? Rubber surround? Damped cone? and in what combination to improve the situation? etc... I've emailed a couple driver manufacturers about this and got some pretty mundane replies from 2, none from the others. I gotta admit that I find it hard to believe there isn't some serious data on this somewhere. Too bad no one is sharing.
Dan
Dan
Regarding cone motion and directivity, in general the situation is so complicated that it requires something like Loudsoft to calculate. But the "bottom line" isn't so complicated.
In general once the diaphragm begins to break up the polar response is all over the place with nuls and peaks at all different angles and frequencies. In short, if one is trying to achieve any form of constant or controlled directivity, operating in the breakup region is simply not possible. This means that the complex calculations, while nice, aren't going to tell you anything that you don't already know - you can't use the driver there.
All drivers will begin to have a wider directivity than a flat piston as freq goes up because of the angle of the cone. The deeper the cone the wider it will get. Then the first non-rigid effect tends to be the outside edge of the cone which starts to move more than the body and so there is usually a gradual rise in the response as well as a bit of narrowing. Then the outside rim goes into resonance with the surround and usually there is a deep null following that. But by this time the directivity has gone all to he11 and you simply cannot use the driver this high. This first resonance is critical and IMO the only one that matters. It needs to be as smooth as possible.
In general, a pleated surround with "doping" is the best solution and paper cones are the better damped. The only drivers that I have seen that I find acceptable at these first reonances have paper cones and pleated surrounds with heavy damping. This of course ruins any HF response, but that doesn't matter because I don't use the driver up that high anyways.
I gotta admit that I find it hard to believe there isn't some serious data on this somewhere. Too bad no one is sharing.
Dan
They can't share what they don't know. You give these guys way too much credit. For the most part nobody cares about the kind of stuff we are talking about so they don't take any data. This industry is, for the most part, living on life support and the engineering staff was let go a long time ago.
One of my 2 responses was "we don't measure that."😕 Sad. The other one was something to the effect of 'in the end it's just luck'(paraphrased) WTH? I was unaware of luck being an answer in engineering. I have to admit I find it frustrating.They can't share what they don't know. You give these guys way too much credit. For the most part nobody cares about the kind of stuff we are talking about so they don't take any data. This industry is, for the most part, living on life support and the engineering staff was let go a long time ago.
Yes, to prevent bleed through especially well off axis if your desiring narrow directivity above the crossover frequency.This first resonance is critical and IMO the only one that matters. It needs to be as smooth as possible.
Thanks for the characteristics of well behaved drivers and clues to its directivity behavior! Much appreciated. What I gather from what you said is that the initiation of break up is indeed the "rim" resonance. So that needs to be where I look first. Is that correct? I know you told me about this before, but it didn't really sink in concretely.
The combination of those to factors are invaluable to the DIYer-- woofer directivity and break up onset and character.
Can you show one polar graph of a reasonably well behaved driver out to 90 degrees?
Thanks again,
Dan
Dan
Your experience is really the standard. The driver manufacturers obsess over those things that don't matter much, like TS, x-max, Klippel nonlinearity plots, and the like and don't even measure those things that do matter. And people wonder why so many loudspeakers are so bad.
I can't post anything from here (China) but when I get home I'll add one of my woofers to my Polar_map plotting software and you can see what the data looks like.
Dan
Your experience is really the standard. The driver manufacturers obsess over those things that don't matter much, like TS, x-max, Klippel nonlinearity plots, and the like and don't even measure those things that do matter. And people wonder why so many loudspeakers are so bad.
The real driver is money. There is always a battle between the world of engineering and marketing.
Engineering loves to play in the sandbox. If left unchecked they would never complete a project because they will continuously perfect the project ad infinitum.
Marketing on the other hand is wringing their hands because every day that goes by without product on the shelves is a day's loss of revenue.
In the end it is a compromise between the two forces. If management skillfully works that compromise you get a timely project that is well designed. If rushed, you get junk. If too late in the development cycle you get last place in the market scramble, which means that you get whatever is left after your competition has raped the market.
There is a great push to be first to market and that usually results in poor product quality or features or both.
There is also market buying trends. A company will focus on what they perceive the largest share of the market wants or trends to. Most of the market just looks at power rating and how much bass can they thump out.
A great example of this type of pin point marketing with MP3 and CD music is the way music is excessively compressed. The market has shifted from high fidelity music accuracy to a market to serve iPods and car stereos.
- Status
- Not open for further replies.
- Home
- Loudspeakers
- Multi-Way
- Measurements: When, What, How, Why