I don't think the LM3886 is designed to drive that kind of load, it's distortion figures are also very load dependent. Attached is an example of load impedance for an LM3886 amp in one design. The sound of the LM3886 with the NS sample application is also sensitive to power supply performance. Work has been going on around the LM3886 amp for over 8 months.Hi soongsc, unless I run only one woofer, then getting the impedance up to 6 ohms is going to be next to impossible. I'm currently running an LM3886 chipamp, and it is not even getting warm. Also I'm planning on running with a 2nd order active cross to my subs at 200Hz so the amp won't be struggling so much.
I had considered putting a zoble on the tweeter to flatten it's resonant peak. The impedance peak between 3 and 4k is the notch filter, and the tweeters impedance rises naturally as well, flattening it would I would think cause the high freq to rollof to be much higher than it already is.
Impedance curves of the woofers in box and the tweeter (in box) are attached. I think you will see from them that I will really struggle to flatten the impedance without totally destroying the sound 🙂 The tweeter is supposed to have a resonant freq of 700Hz so it is quite a way off that!
edit: since I hadn't posted individual responses before I've added the woofer and tweeter measurements at 1.5M on axis Mic level with the tweeter and 1.36M off the ground, 1.2M from the ceiling and around 1.3M to the nearest furniture either side. These measurements combined with the impedance measurements are what I've been using in speaker workshop for my sims.
Tony.
Attachments
Last edited:
Originally Posted by gedlee 
HI Tony Several disagreements
1) most experts that I know are fairly well in agreement on what needs to be measured and how to interprete the results. Most DIY are not.
Nonsense- if this were true there would be no new papers or discussion on measurements, methods, or their meaning yet the journals are ripe with them.
Thanks Tony!OK Well here is the completely raw response roughly at my listening position on my lounge. It is roughly because I had trouble getting my mike to sit properly so it is a little bit lower than it should be, probably about 15cm lower.
Also attached for comparison is 1/32 octave smoothed (using holm impulses complex smoothing as it shows the dips much better) and 1/16 octave smoothed. and just for the fun of it a 1/3rd octave smoothed (normal amplitude smoothing) curve. You can see why manufacturers show graphs with 1/3rd octave smoothing!! The hump at 60Hz I suspect was a car driving into the garage downstairs as I was taking the measurement. The woofers should be down about 10db at that point. Resonant freq of the box is around 82Hz, the intention is to cross to the subs at 200Hz.
Oh and I forgot to answer your query as to what my woofers are. The are Morel MW144's. If you saw the near field response earlier in the thread, then you will be able to tell that pretty much all of the response irregularity up to 2Khz is either baffle diffraction or room interaction.
Tony.
I used to own some 164s many moons ago, and I'll look for that near field response.
That 60Hz bump could well be a room mode. Off a single point it's really hard for me to tell where your room is going modal. Can you post more graphs overlaid from points around your listening position? This helps the modal region stand out in my room and I suspect yours will be the same. Another thing that's interesting is how little comb filtering you are getting where your directivity is narrow. Is that graph just one speaker? It looks like one speaker from what I've done. FWIW, I don't think comb filtering is as bad of a deal as many people believe. The ability to hear through the room has been demonstrated. In any case, if you believe Dr. Olives research, we should eq above the modal region in pseudo anechoic conditions, and eq the modal region from the in room response. My personal problem with that is that I cannot get the resolution I would like from my pseudo anechoic measuring position in the 200Hz - 800Hz for a good EQ setting. I think I need to do that region near field for best results. That's what I believe my room response graphs are telling me and thus the reason why I think the room response from multiple positions in the listening area past the modal region is somewhat useful.
Another thing that's interesting to me is that my 600Hz(ish) bump isn't obvious when listening. It might be for Harman's trained listeners however. The same size bump, but narrower band, off axis at 2 kHz seems completely obvious and painful to even me.
I should do some more measurements today. It will either refute or support my current belief(s).
Dan
Take a week off. It helps me "clear my head" when I get frustrated trying to figure things out.
Rob🙂
Hehehe I took 4 years off 😉 (but was still listening to the old speakers during that time).... but yes very good idea! I tend to get obsessive about things and taking a break is a good idea!
Dan,
I had another at listening position measurement, this one with a different mic (not on the wand) which was able to be better positioned. I've attached. blue trace is the newer measurement, both 1/16th octave smoothed. and it would appear that the 60Hz bump is real, might explain why I thought the bass was better than I expected it should be without the subs. Oh and yes you are right that is with only one speaker. It was when I had the two notches and didn't have enough components for two crossovers! I could do a stereo measurement now if I can keep my 2yo out of the room long enough 😉
soongsc, I was a bit concerned about the LM3886's ability to drive this load, but so far it seems fine. I need to fix my Series 200 (100W mosfet) and do a comparison. I suspect that measurements done with the two (provided levels can be matched) will be identical.
Tony.
Attachments

Last edited:
Tony, is this the graph you were discussing?
Looks good to me.
I was going to do some measurements today, but REW won't let me. This is the first problem I've had with it.
Dan
Looks good to me.
I was going to do some measurements today, but REW won't let me. This is the first problem I've had with it.
Dan
Hi Dan, no I'm not sure what that one was, but it was probably with an earlier implementation of the crossover, and was a gated measurement.
The nearfield measurement was discussed in this post It was actually showing the difference between bare box and with the box lined with damping material. I've attached here again.
Note that this is a raw response graph. there is NO smoothing at all, what you see is what you get. measurement taken about 5mm from one woofer only. I don't think it would be possible to get a reliable nearfield measurement of the two woofers running together due to the interference that would occur when too close. I also did a groundplane measurement which I have at home.
Tony.
Attachments
Last edited:
Waveguide and woofer polars and how they combine, 0° - 45° in 5° increments:
Flex Your PCD Mettle: - Page 15 - Techtalk at Parts-Express.com
Flex Your PCD Mettle: - Page 15 - Techtalk at Parts-Express.com
Not suren what your definition of "fine" means. Even the distortions figures change with the load, plus the reality of a complicated varying load. I was under the impression you were not satisfied with the sound, so I thought maybe you have some measurements to explain why you think the LM3886 is fine driving that kind of load?...
soongsc, I was a bit concerned about the LM3886's ability to drive this load, but so far it seems fine. I need to fix my Series 200 (100W mosfet) and do a comparison. I suspect that measurements done with the two (provided levels can be matched) will be identical.
Tony.
Hi soongsc you are right it could have been the amp and not the speakers that were causing problems. I had a notch filter at 1K in addition to the notch filter at 4k on the woofers, and it didn't sound good, did sound distorted, though distortion measurements of the speaker (using holm) didn't really show any difference between the two configs.
After removing the 1K notch I'm quite happy with the sound, but not so happy with the freq response measurements 🙂 I had difficulty deciding whether I was interpreting the measurements correctly, and which ones were in fact the better ones.
By fine on the amp, I meant it wasn't overheating, which is usually a sure sign something is wrong. It hardly even gets warm at normal listening levels. I can also crank the volume up above what I could comfortably listen to in my room, without it sounding distorted (now the 1k notch has been removed).
I geuss I could do RMAA measurements with an 8 ohm dummy load, and with the speakers attached and compare the results 🙂 I'd never actually considered doing that before 🙂
I haven't had the chance to do any more measurements, but I'll also look at doing one with the amp part of the DUT as you suggested before.
Tony.
OK, got the measuring rig up and running again. The 600 Hz bump I have is not caused by the woofer. It's some room related issue. Guess that's why I couldn't hear it on any recordings.
Dan
Dan
Here's an interesting effect. This is my Sub's near field response:

and what happens to it from my five listening positions:

Clearly modal!
Dan
and what happens to it from my five listening positions:
Clearly modal!
Dan
Last edited:
Here's a waterfall plot for the purple line
An externally hosted image should be here but it was not working when we last tested it.
Interesting. I'd love to see some actual data on it if anyone has such a thing. Still I'm going to try and do some experimenting this week if I have the time. It is of huge importance to designing a CD speaker. It stinks that only Augerpro has both these measurements posted, but not near the detail I'm looking for in the polar response. Where I run into issues is generally at the 45 degree point and beyond.
Anyone know why some cone resonances change in frequency as you move further off axis?
Anyone know why the amplitude of the resonances seems to increase well off axis?
Dr. Geddes, are you suggesting foam for woofers? That's an interesting idea, but I'd think it would have to be pretty thick. It might also help reduce the more audible higher HDs as well. Not that they are too much of a problem. Maybe they could be with light metal cone driver?
Thanks,
Dan
Hi,
I never saw the answer the to this question (Bolded). I'm also a little curious.
I'm guessing it's a gradual change in phase (doppler effect?-lol?) as you change position from the cone which moves forward and backward, but only on axis. No driver can move directly toward the mic except at zero degrees.
If it's phase related, then I guess that would tie into the amplitude part of the question. Since all the frequencies are actually decreasing but changing in phase, then the peaks and dips would start to appear at different frequencies since drivers are not phase linear across their bandwidth.
So in essence it looks like larger peaks, but rather larger dips going out of phase + lower off axis amplitude. The changing peaks left would be residual power going in phase at those different frequencies.
umm... Of course I could be all wrong and would seek more professional advisement.
However, having an extra ton of trash frequency slapping off side walls only to be mixed in with decent on-axis behavior would not seem beneficial to me.
In reference to testing, which admittedly I have little experience, I have to wonder if there is a good set of objective data that correlates to different loudspeaker technologies, and how they relate to subjective choices. I don't mean grabbing Joe-Six-Pack off the street to some wildly blind brand A vs B mass market test that proves nothing about fidelity. I'm talking about individuals who actually have preferences based off of current technology in systems comprised of varying topologies, dynamic drivers, electrostats, planar magnetics, horns, or what have you.
Can those measurements be made objectively and correlated to those subjective choices? Have they already been done?
As a subjective listener, and a budding DIY'er, I'm compelled to make my choices based on subjectivity first, then use objectivity to begin design and refine. How else can one begin?
Last edited:
In reference to testing, which admittedly I have little experience, I have to wonder if there is a good set of objective data that correlates to different loudspeaker technologies, and how they relate to subjective choices. I don't mean grabbing Joe-Six-Pack off the street to some wildly blind brand A vs B mass market test that proves nothing about fidelity. I'm talking about individuals who actually have preferences based off of current technology in systems comprised of varying topologies, dynamic drivers, electrostats, planar magnetics, horns, or what have you.
Can those measurements be made objectively and correlated to those subjective choices? Have they already been done?
As a subjective listener, and a budding DIY'er, I'm compelled to make my choices based on subjectivity first, then use objectivity to begin design and refine. How else can one begin?
I don't believe you can categorize the different technologies like that. Each has it benefits and its negative tradeoffs. You have to decide for yourself what attributes are most important to you and select the technology that provides that.
As far as the mechanism to test loudspeakers goes, I am a big fan of objective testing first. I know of experts in the industry that never listen to the loudspeaker as a means to design and tweak it. They are very successful at it, too.
This tells me that all the important attributes that make up a quality loudspeaker are measurable by testing!
The problems that most of us stumble with are how and what to test, but most importantly, how to interpret the results.
Unfortunately, this is the reality of learning to become a proficient expert. It takes a lot of time and devoted study. There are no shortcuts to the path of wisdom.
Hi,
I never saw the answer the to this question (Bolded). I'm also a little curious.
A resonance could not possibly change in frequency with angle. But diffraction or a reflection can and do. So that is most likely the situation.
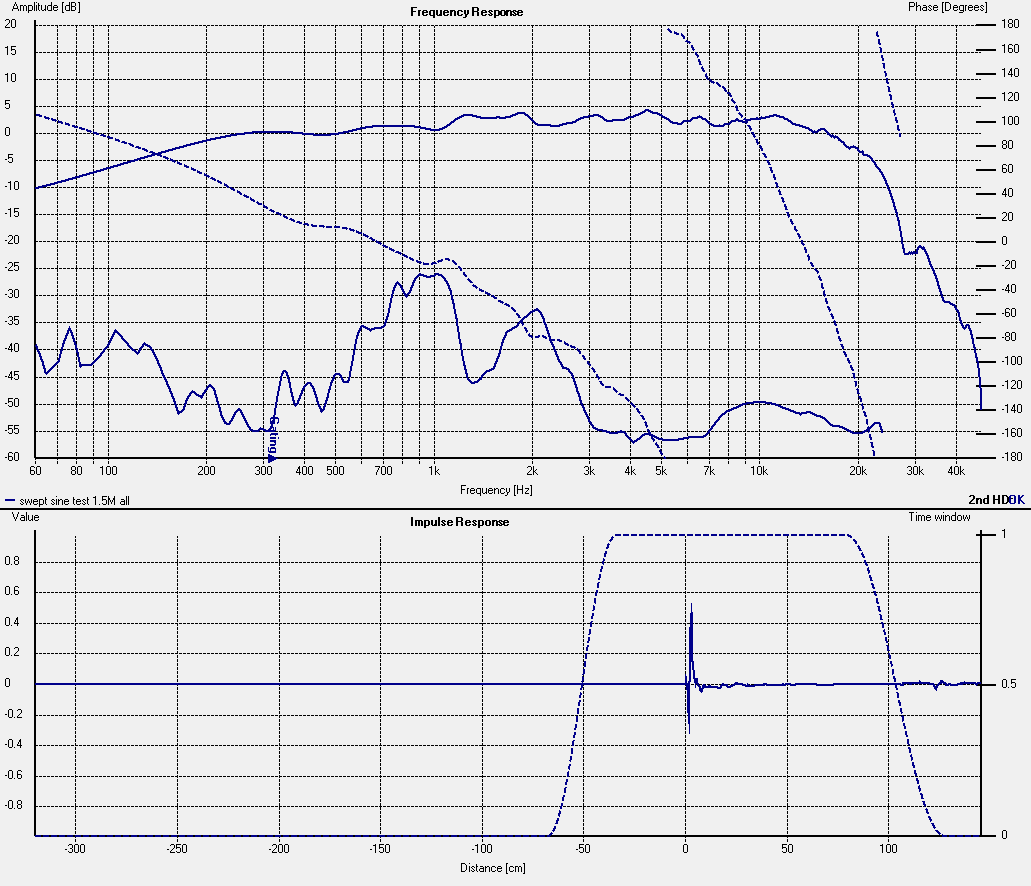
Dr. Geddes (or anyone capable of giving an educated guess), could you just analyze this for a second? So what makes one woofer behave like this:

(this measurement was taken with the start of a crossover in place)
See how the first break up stays at roughly the same frequency.
and another behave like this:

The break up changes frequency with axis. The box is nearly identical, but the cone shape is drastically different. Both are paper cones, but the one on top is treated with some proprietary stuff, rubber surround (material unknown exactly) and has a concave dust cap. The second woofer is untreated, convex dust cap and cloth accordion surround.
Thanks,
Dan
(this measurement was taken with the start of a crossover in place)
See how the first break up stays at roughly the same frequency.
and another behave like this:
The break up changes frequency with axis. The box is nearly identical, but the cone shape is drastically different. Both are paper cones, but the one on top is treated with some proprietary stuff, rubber surround (material unknown exactly) and has a concave dust cap. The second woofer is untreated, convex dust cap and cloth accordion surround.
Thanks,
Dan
Dr. Geddes (or anyone capable of giving an educated guess), could you just analyze this for a second? So what makes one woofer behave like this:
(this measurement was taken with the start of a crossover in place)
See how the first break up stays at roughly the same frequency.
and another behave like this:
The break up changes frequency with axis. The box is nearly identical, but the cone shape is drastically different. Both are paper cones, but the one on top is treated with some proprietary stuff, rubber surround (material unknown exactly) and has a concave dust cap. The second woofer is untreated, convex dust cap and cloth accordion surround.
Thanks,
Dan
Just one thing that stands out to me is how similar the extreme off-axis plots are between the two. So box diffraction and/or room is ruling the day here.
How do you do the off-axis tests? Do you rotate the speaker or move the mic?
There are probably a lot of variables that determine the behavior of cone breakup. However, how confident are you in your measurement techniques?
I rotate the speaker and I am very confident in my measurement technique. I've done it many many times with repeatable results. It's really not difficult.
Time to go to work.
Dan
Time to go to work.
Dan
Thats simple polar response. The null move location with frequency. see why polar aspects of a loudspeaker design can get complicated.
- Status
- Not open for further replies.
- Home
- Loudspeakers
- Multi-Way
- Measurements: When, What, How, Why