Exporting of multiple IR table is implemented in Arta Recorder 1.3.2. Number of samples is constant 4301. Angle is detected from the file name between "deg" and ".pir".
Nice! Looks very familiar. I guess you are using the Auto-it dll in dotnet also.
Very very impressed by your VituixCAD software, that must have been lots of programming, and this for a DIY project. Great work
For my two cents I prefer the geddes colour perhaps as suggested with some more contrast.
It makes sense to me that colour intensity follows frequency intensity.
It is also so the format used in other measurement areas such as infra red images.
It makes sense to me that colour intensity follows frequency intensity.
It is also so the format used in other measurement areas such as infra red images.
It would be very interesting if a speaker like this could be measured with 2deg angular increments and then compared with the results of your modal approach using the 14 angle subset of those same measurements.
I think I have some "bad" speakers I can measure to make a comparison between every degrees and the 14 angles...
Nice! Looks very familiar. I guess you are using the Auto-it dll in dotnet also.
Thanks! I'm using TestStack.White library - not AutoIt. ArtaRecorder is about as old program as AutoIt macro for ARTA - which I've seen afterwards but never used. My recorder was buried for two years because original implementation without UI automation library was unreliable, and I swapped to CLIO which has integrated auto save feature. A month ago Heinrich aka ente asked me to publish the program, and this is the result.
Thanks! I'm using TestStack.White library - not AutoIt. ArtaRecorder is about as old program as AutoIt macro for ARTA - which I've seen afterwards but never used. My recorder was buried for two years because original implementation without UI automation library was unreliable, and I swapped to CLIO which has integrated auto save feature. A month ago Heinrich aka ente asked me to publish the program, and this is the result.
I also had some reliability issues when using auto-it in the beginning, but currently this part is pretty stable (at least on my measurement system). I used a clio system before (an old clioDos version I bought 2nd hand), but this is now very obsolete when compared to a system like ARTA. The newer versions look excellent, but I do not want to spend that kind of money.
I had some private conversations with Ente also about publishing my software (which was my initial intention), but in my case this means making everything open source (I used some open source frameworks with a GPL licence), and for some parts of the tool I do not want to make the source code available. I have been planning to rewrite the GPL parts (so I can make my tool available), but because rewriting the same program is pretty boring and I do not have so much free time, I have never came around to actually do this.
Basically my program does the same what you did in your ArtaRecorder (my first versions where almost identical, so funny to see without knowing about each other), but the current version also allows you to:
- load and save configs for almost every setting in ARTA (this make it easy to make to switch between measurement setups)
- manage measurements results with comments in a web browser for easy retrieval
- control the automatic and a manual turn table
- generate a pdf report of all the measurement data, views and settings used (so you have a single document with all info grouped)
For my two cents I prefer the geddes colour perhaps as suggested with some more contrast.
It makes sense to me that colour intensity follows frequency intensity.
Yes intensity -> intensity mapping makes a lot of sense to me as well. But I absolutely have to increase the contrast and line density, I can see that now.
I am finally rewriting the complete software set to a common core, which is going well. I will make these changes then. I also found that having different optional sets of color would be easy, so I will probably do that as well.
Now if Microsoft would only get on the ball and find out what the problem with my VS2013 then I can post all this to my website again. I am now on my third person trying to sort out the issue. Lots of people can solve the typical easy problems, but it seems that the harder ones get passed around until they go away.
Anyone know anything about "Git"? That's my error, but I can find out why.
Git? Do you mean this? Git This Git is used extensively in the Linux world. It can be used for Windows as well. But its a revision control system. At first I gather its a little difficult to master. Your not sharing development so it seems odd for this to show up? My experience is limited to a few commands but its well documented.
1audio
Yea, I learned that much already. Windows reports an error that "Git" cannot be found or is not on the "path". The "path"? Isn't that obsolete? I use version control through VS-2013, but I didn't think that was Git. This Git error shows up in two places. On Windows all I can find is GitHub, nothing called just Git. There is no Git executable on my system. I am at a loss and apparently so is Microsoft!
Yea, I learned that much already. Windows reports an error that "Git" cannot be found or is not on the "path". The "path"? Isn't that obsolete? I use version control through VS-2013, but I didn't think that was Git. This Git error shows up in two places. On Windows all I can find is GitHub, nothing called just Git. There is no Git executable on my system. I am at a loss and apparently so is Microsoft!
Ok, so here is my speaker again:
- box volume: 100 l
- speaker f0: 50 hz
- speaker Qtc: 0.41
Attached is the response that I get.
I am having trouble with the LF response as stated. A 50 Hz resonance in a closed box with a Q of .41. That seems highly implausible to me and the data looks the same. The response is down 6 dB at 60 degrees at 300 Hz, which implies a large diameter driver (which you did not actually specify so I guessed it at 26 cm.) A driver that large in a 100 L box with f0 = 50 Hz and a Q of .41 !?! What kind of driver is that?
If it is alright with you I'll add this to my database once you explain how you were able to achieve the LF as stated.
Attachments
1audio
Yea, I learned that much already. Windows reports an error that "Git" cannot be found or is not on the "path". The "path"? Isn't that obsolete? I use version control through VS-2013, but I didn't think that was Git. This Git error shows up in two places. On Windows all I can find is GitHub, nothing called just Git. There is no Git executable on my system. I am at a loss and apparently so is Microsoft!
The path is still there and some applications and processes still use it. You can check it here: my computer => properties=> advanced system settings=>environment variables
Git is the program and there would be a set of scripts to handle the various functions. Github is an open source hosting service for projects. Having git on the path suggests some code is calling a git process (git pull to get the source for example) and its not there. You can get Git for Windows here: Git - Downloading Package . Possibly installing it will unlock whatever and get the project moving. Possibly there is some open source pieces in what your doing that need to be pulled. Microsoft would not ever host open source stuff. Their lawyers would explode. True for most big corporations.
For what its worth Linux source is hosted on a git server. It all works quite well.
I've looked at the path in properties, but you can only view about 20 characters at a time and it is almost 256 characters long. Is there no way to see the whole path? Maybe in the registry?
_wm_
It dawned on me that maybe your specs were for the driver NOT in the box. That is not what I need. I need the driver radius, box volume, F0 in the box and Q in the box. I can't calculate the F0 and Q in the box without a lot more info, but I am sure that you would know these.
I still don't understand the high directivity at 300 Hz. however.
I've looked at the path in properties, but you can only view about 20 characters at a time and it is almost 256 characters long. Is there no way to see the whole path? Maybe in the registry?
Now you are asking me to pull up 20 year old DOS commands. Ouch. Open a command window then type "path" and you will get the whole path statement.
I think you will need to install git for windows and then figure out where the missing code is hosted. I usually find Google searches more useful the the help desks. Often they are just doing the same Google search.
I think I have some "bad" speakers I can measure to make a comparison between every degrees and the 14 angles...
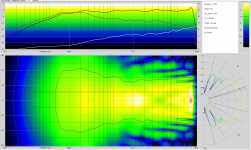
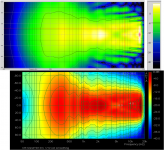
Actually, the speaker you provided data for in post#169 may be ideal for the purpose.
The attached comparison shows 3 clearly define lobes off the main axis in the Gedlee polar map that are not even hinted at in the ARTA sonogram.
Can you make measurements of this speaker at every 2 degrees?
If so, and the lobes show up, this would provide clear substantiation of the Gedlee modal analysis.
You could create the 14 angle data subset for processing by Gedlee so the comparison is using the same parent data set.
@Gedlee,
Do you see any issue with this plan that would invalidate the comparison?
For example, would the ~4mS window compromise the processing in the frequency range of the lobes?
Attachments
Do you see any issue with this plan that would invalidate the comparison?
For example, would the ~4mS window compromise the processing in the frequency range of the lobes?
Bolserst
Not if the 2° data were plotted in some independent software whose "smoothing" scheme is know - preferably there isn't one. Plotting in ARTA, or in my program, does not guarantee that the data is correct, it could be done the same way for 2° as it is for the wider spacing.
I don't think that the 4 ms window is an issue at the frequencies that we are talking about. Spatial aliasing is. We already know that both programs alias above 10 kHz for very difficult data. This data does seem to be ideal however.
The lobes shown in those plots are not classic lobes. The usual pattern is for the lobe to swing down from a wide angle at LFs to a narrower angle as the frequency goes up. Lobes that do the opposite, like those shown, must be something else. If this were a cardioid box then I would suspect those might be leakage from the sides. I simply have not seen anything that does what is shown in that plot. It is curious and I am curious.
Looking at details like this have helped me in the past to find obscure problems that I did not realize existed. Those "lobes" (for lack of a better definition) might be something interesting that none of use would have expected.
Until we can all understand how one gets 6-8 dB down at 60° at 300 Hz, I think that there is a lot to be explained. All of this data is just not anything like I have seen before. I'd love to know what is what.
Last edited:
On a side issue:
I had an idea and wondered if anyone has ever tried this. I think its best to ask before I make another bonehead move and do something that has already been done before.
While implementing my Critical band smoothing I did this with the use of Gammatone filters. These filters were derived to represent the manner in which the wave crests over the cochlea. So they are the closet set of filters to the way that the ear actually works to discriminate tones in signal. All speech recognition is done with Gammatone filters.
Now in the process of implementing these filters I get the impulse responses of a large set of filters which when staggered together completely cover the audio bandwidth. There are probably 30-40 of them to cover the range of 40 Hz - 10 kHz, probably another 15 to go to 20 kHz.
These filters define an orthogonal set of functions which span the frequency space that is desired. This means that any signal can be uniquely expanded into this set. Here is the carrot. Using this set does not require a window. All that is required is to fit these filter bank levels to the data based on what data is actually available. Unlike using an FFT which makes certain assumption about data outside its window, the gamma tone filters are not periodic and no such assumptions are required.
This is a lot like wavelets and or Prony estimation (for those who know Prony).
Is anyone aware of this being done any place? It would allow for a good estimate of the LF response from contaminated data.
PS. in the old days such a method would be absurdly slow. Today, it wouldn't be a problem.
Last edited:
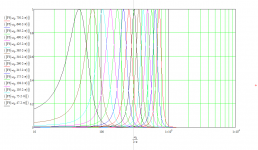
FYI, a set of gamatone filters to about 800 Hz.
The number of filters that span the frequency range is variable. This set corresponds to a Moore critical band spacing.
The number of filters that span the frequency range is variable. This set corresponds to a Moore critical band spacing.
Attachments
Last edited:
Attached is the response that I get.
I am having trouble with the LF response as stated. A 50 Hz resonance in a closed box with a Q of .41. That seems highly implausible to me and the data looks the same. The response is down 6 dB at 60 degrees at 300 Hz, which implies a large diameter driver (which you did not actually specify so I guessed it at 26 cm.) A driver that large in a 100 L box with f0 = 50 Hz and a Q of .41 !?! What kind of driver is that?
If it is alright with you I'll add this to my database once you explain how you were able to achieve the LF as stated.
I used the values that I had in old notes, but after some re-evaluation, they seem pretty correct.
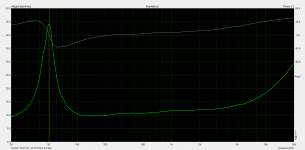
The actual Qtc is probably a bit lower, because I did not take into account the box stuffing (which would enlarge the apparent volume). BTW, the driver used is an AE speaker TD12M, you can find the thiele small parameters here: http://aespeakers.com/aes_store/catalog/product_info.php?cPath=23&products_id=108 Driver diameter is 30 cm.
Based on the thiele small parameters above, and a box volume of 100 liter (not incorporating stuffing), Qtc calculates to 0.39 and Fb to around 62 Hz. I had however an old impedance plot (see below), which shows that Fb is around 50 Hz. Doing the reserve calculation, this would mean apparent box volume needs to be around 188 liters (this seems a little to big effect to be stuffing alone), and Qtc around 0.33.
I did not measure the thiele small parameters of the actual drivers, so this could make some difference also, but deviations should not be too big.
Attachments
Actually, the speaker you provided data for in post#169 may be ideal for the purpose.
The attached comparison shows 3 clearly define lobes off the main axis in the Gedlee polar map that are not even hinted at in the ARTA sonogram.
Can you make measurements of this speaker at every 2 degrees?
If so, and the lobes show up, this would provide clear substantiation of the Gedlee modal analysis.
You could create the 14 angle data subset for processing by Gedlee so the comparison is using the same parent data set.
@Gedlee,
Do you see any issue with this plan that would invalidate the comparison?
For example, would the ~4mS window compromise the processing in the frequency range of the lobes?
I have measured this exact speaker at every degrees and added the polar plot here http://www.diyaudio.com/forums/multi-way/261616-measurement-technology-8.html#post4055223
The lobing is not visible. The raw data can be downloaded from my cloud.
I hope you can figure it out, because I have no idea. I can only help by taking additional measurements if requiredBolserst
Not if the 2° data were plotted in some independent software whose "smoothing" scheme is know - preferably there isn't one. Plotting in ARTA, or in my program, does not guarantee that the data is correct, it could be done the same way for 2° as it is for the wider spacing.
I don't think that the 4 ms window is an issue at the frequencies that we are talking about. Spatial aliasing is. We already know that both programs alias above 10 kHz for very difficult data. This data does seem to be ideal however.
The lobes shown in those plots are not classic lobes. The usual pattern is for the lobe to swing down from a wide angle at LFs to a narrower angle as the frequency goes up. Lobes that do the opposite, like those shown, must be something else. If this were a cardioid box then I would suspect those might be leakage from the sides. I simply have not seen anything that does what is shown in that plot. It is curious and I am curious.
Looking at details like this have helped me in the past to find obscure problems that I did not realize existed. Those "lobes" (for lack of a better definition) might be something interesting that none of use would have expected.
Until we can all understand how one gets 6-8 dB down at 60° at 300 Hz, I think that there is a lot to be explained. All of this data is just not anything like I have seen before. I'd love to know what is what.
Last edited:
- Status
- Not open for further replies.
- Home
- Loudspeakers
- Multi-Way
- Measurement technology