scott wurcer said:In a normal triple there is a string of Vbe's that define the input to output transfer function. Here you actually can inject some voltage via the Vcb of those transistors. That is where I was looking for some interesting action.
I wonder if it would make sense to replace the models of these almost-saturated transistors with the 1381/3503 (also in the same model file). Those have quasi-sat parameters specified, while the 340/350 do not.
andy_c said:
I wonder if it would make sense to replace the models of these almost-saturated transistors with the 1381/3503 (also in the same model file). Those have quasi-sat parameters specified, while the 340/350 do not.
It might show something interesting, the currents due to quasi-sat get very funky.
scott wurcer said:
Yes, what is hard to picture totally is the behavior of the nearly saturated transistors. In a normal triple there is a string of Vbe's that define the input to output transfer function. Here you actually can inject some voltage via the Vcb of those transistors. That is where I was looking for some interesting action.
andy_c said:
I wonder if it would make sense to replace the models of these almost-saturated transistors with the 1381/3503 (also in the same model file). Those have quasi-sat parameters specified, while the 340/350 do not.
Yes, the saturated transistors are definitely where all the action is
and the problems for spice. As such I tried substituting many
different device models there, operating various currents and using
additional small additional series R's to vary the amount of
saturation but so far cant get the simulated THD below 0.02%.
I'm still using LtspiceIII so that probably isn't helping.
The simulator has really got to get the 'knee' of VCE right with them
and also the current that is diverted to the base which modulates
the diode string bias.
Scott, how close are these spice models to the real thing WRT
operating in this region?
T
Terry Demol said:The simulator has really got to get the 'knee' of VCE right with them
and also the current that is diverted to the base which modulates
the diode string bias.
A lot of the models don't specify the quasi-sat parameters at all, unfortunately. They are necessary to get the most accurate behavior possible from the model in this region. However, these parameters aren't described in the standard SPICE modeling texts such as Massobrio and Antognetti (except for how HSPICE implements them). They were originally documented in this paper:
G. M. Kull, L. W. Nagel, S. W. Lee, P. Lloyd, E. J. Prendergast, and H. K. Dirks, “A Unified Circuit Model for Bipolar Transistors Including Quasi-Saturation Effects,” IEEE Transactions on Electron Devices, ED-32, 1103-1113 (1985).
I'd love to get a copy of this paper if anyone has it.
BTW, LTspice III supports quasi-sat fine.
Also, I tried the 3503 and 1381 in those locations in the sim, but I'm getting oscillation.
Steve Dunlap said:I intend posting a final (I hope) version that matches the board tomorrow. ...
If it's not too much trouble, could you please mark the polarity of electrolytics - we don't want caps' firework on top of everything, right?
😉
Terry Demol said:
Scott, how close are these spice models to the real thing WRT
operating in this region?
T
It's very simulator dependent. All I can say is that quasi-sat is very important in modern high speed thin epi processes (I'm sorry if this is greek to some). I have only used this to judge "bad" behavior and our environment works pretty well. It's ironic now that I tried LTSpice, it does some things easily that I have to put a work order in for to the CAD group for a custom behavioral model.
juma said:
If it's not too much trouble, could you please mark the polarity of electrolytics - we don't want caps' firework on top of everything, right?
😉
BTW - I just coughed up my annual donation to the diyAudio beg-a-thon. So if there are any of you out there that haven't paid up you are not entitled to bad mouth me, pick on me, give me grief, or in any way mess with me. If you paid up - well - don't do that stuff anyway - it's rude.

Attachments

>In the meantime "over there" they are still claiming that the
distortion is something like 0.2%. Based only on simulations of course. Maybe they don't realise that every time they say something like that they are, by implication, calling me an idiot, a liar or both.
I guess I'll drop out of this now. Seeking a little actual reusable knowledge is again considered a personal attack.
scott wurcer said:
I guess I'll drop out of this now. Seeking a little actual reusable knowledge is again considered a personal attack.
I take it you quoted that from exileHiFi?
Not a fanboy and personal cheering section? GTFO.
They don't want any discussion on the circuit here.
I agree ---, the noisefest over there p***ed me off also, that's why I wanted to post the Krill schematic here & get some sensible comments rather than the s**t that passes as contributions over there & stifles any real information coming through. The last straw on this was the endless discussion about class A, blah,blah. Just couldn't take it any more!
c2cthomas said:BTW - I just coughed up my annual donation to the diyAudio beg-a-thon. So if there are any of you out there that haven't paid up you are not entitled to bad mouth me, pick on me, give me grief, or in any way mess with me. If you paid up - well - don't do that stuff anyway - it's rude.
Sorry Thomas but I fail to see what's so rude in my plea for marking elko's polarity on the schematic?
When someone publishes a sch. and invite people to build it, IMO, provisions for basic safety have to be made. Reversely polarized elkos can literally explode. If it's eventually bound to happen let it be out of builder's ignorance, not because of author's negligence.
I don't want to think that what we have here is "buy my PCBs and you'll be OK" approach - nothing wrong with that either, but in that case the thread should be in Vendor's Bazaar section.
I also don't understand what it has to do alltogether with donating money to diyaudio site?
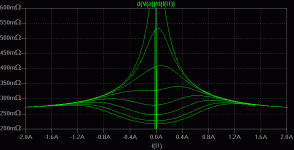
andy_c said:I've attached a plot of the simulated nonlinear DC output resistance d(V(out))/d(I(out)) with Iout going from -1A to +1A. For +1A, the amp is sourcing current, thus the minus sign in the expression for the derivative. Rbias is stepped from 2.9k to 3.4k in 100 Ohm steps. The topmost curve is 2.9k and the bottom is 3.4k. You can see the overbias condition at 3.4k (small-signal Rout much less than large-signal Rout).
Hi Andy,
Excellent simulation model, very useful. 🙂
How sure are you that 3400 is the optimum value of Rbias?
Hint: why did you limit Rbias to 4K in your simulation?
Brian
KSTR said:Thanks for that, Andy. A perfect complement to the graph I've shown.
Klaus,
Measuring output R is informative.
Is it the best measure of linearity of this OS?
Brian

Brian, I'm not sure what exactly you are asking (language problem, probably I need another cup of coffee to get it...).traderbam said:Measuring output R is informative.
Is it the best measure of linearity of this OS?
What I can say that both Andy's and my "test" are compromised, because I used a linearized AC analysis with varying bias conditions, and Andy's plot is at DC.
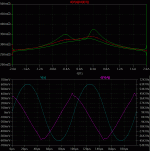
I now tried to plot Zout his way (Bbias=2.9k), but using sine wave current injection at various freqs. With low freq (100Hz, red line in the top graph) I get Andy's curve as expected, but at 10kHz things do get fancy. I'm not exactly sure wether the plotted quantity really resembles output impedance, though. Still I find it interesting that the curves split up in seperate legs depending on where we are in the cycle, and this splitting increases with freq. Something is going on here, the cap and/or stored charges and all...
Anyhow, when I look at the output voltage with 2 amps injected (input held at 0V, er, ~0.3V that is, to compensate for the offset) it can be seen that there is signficant distortion (log says 2.5% THD). Also note the phase shift, which plays its role in the observed splitting.
Wether this VR stuff all has any relevance for the real thing that Steve has built? We just don't know.... and I haven't gone into the details of the stage in all depth, let alone built it, so I don't feel entitled to comment.
- Klaus
EDIT: Typos
Attachments
Hi Klaus,
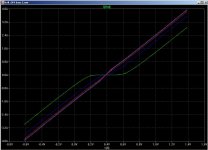
What I plotted is the large signal transconductance of the output stage, that is [V(A) - V(C)] plotted vs Iout for a range of V(A) about 0V and a shorted output, using a 1Hz sinewave (to avoid reactive effects). Each curve is for a different Rbias - ranging from 2k to 10k. I find the straightest curve is when Rbias is in the region of 6k. It is quite easy to see what Rbias does using this plot.
I hope I am using Andy's circuit properly. I think there are various THD minimums and the 3400 value is one of them.
Brian
Hi Juma - Sorry for any misunderstanding there might be - my comments were not intended to be taken as a response to your statement about incorrectly installed capacitors becoming fireworks. That is a correct statement and thus the reason for the fireworks photo - so I agree with you.
The comment about the donation was an attempt on my part to remind people that this website (diyAudio) takes money to run and donations are needed to help them provide the fine service that they do. Many people take advantage of the open and generous nature of diyAudio and never donate any funds to help our friends keep the website running. I donate what I can every year and I like to take the opportunity to remind others that they should donate something as well.
So - nothing personal Juma - I apologize for any misunderstandings.
BTW - have you donated to diyAudio lately? 😉
KSTR said:Anyhow, when I look at the output voltage with 2 amps injected (input held at 0V, er, ~0.3V that is, to compensate for the offset) it can be seen that there is signficant distortion (log says 2.5% THD). Also note the phase shift, which plays its role in the observed splitting.
2.5% is nasty. So you ac grounded V(A) then injected both a dc current of 1A and an ac current at V(C)? What f and amplitude was the injected current? What value of Rbias?
I just tried this using 10kHz and 100mA amplitude, Rbias=3400, and the THD of the FFT of V(C) shows about 0.25% THD with a lot of splatter. With Rbias=6k the THD is about 0.15% H2 and very little splatter.
Brian,
to add to the confusion I relabled the output to A, in order to use one of my standard sim skeletons. Sorry, I forgot to mention that.
In the last plots, I grounded the stage's input, and look at output voltage while injecting current (2 amps pure sine, no DC offset) into the output. Different input voltages change things a little bit, but overall shapes are the same. The THD figure is for the voltage waveform that shows up at the output, @10kHz, 2.9k
I was able to recreate your latest plot, and find that it seems you have taken the right curve but read the wrong Rbias. Happens to me all the time, since LTspice doesn't plot a color coded legend for parametric plots. I find the straightest line again in the 3k region.
Below another plot showing Zout with Rbias starting at 2k, increasing 300Ohms per step. At ~2.9k there seems to some kind of optimum, achieving both benign large signal deviations and a very flat small signal portion (and if we added some 0.2A constant current to the proper rail it would be symmetrical around zero as well). At higher bias currents, it looks that we could have a pretty well shaped -- low order function -- small signal behaviour, but overall curvature gets worse. Still it could possibly give better small/medium signal THD as these curves seem to be less complex than the 2.9k-curve around the zero region, which seems to give rise to mainly even-order distortion. (EDIT: odd-order, I mean).
That's pretty much what you (and other) have said already, one could trim Zout (and distortion, hence) for any specific load/signal condition to get a mimimum, but one would need to make design decisions which load/signal ranges one wants to consider as the most important ones...
- Klaus
Attachments
KSTR said:I was able to recreate your latest plot, and find that it seems you have taken the right curve but read the wrong Rbias. Happens to me all the time, since LTspice doesn't plot a color coded legend for parametric plots. I find the straightest line again in the 3k region.
Edit: Ok, I see. I had a resistor biasing the drivers that was not in the original circuit. Oops.
- Status
- Not open for further replies.
- Home
- Amplifiers
- Solid State
- Krill - The little amp that might...