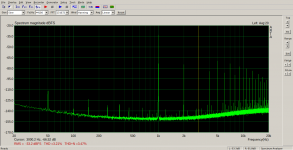
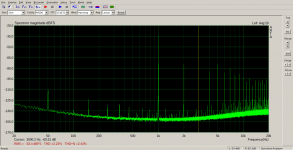
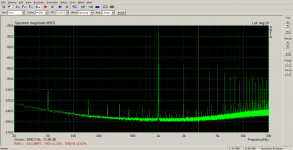
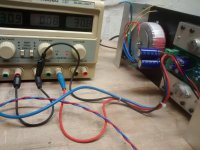
So I measured THD at the gate drive coupled by a 10:1 oscilloscope probe to the analogue recording input. You see the plots with bias current of 50mA, 100mA and 150mA respectively. Output level was close to 10Vrms, 5R load and 1kHz sinewave.
Attachments
Last edited:
Summarizing the above measurements
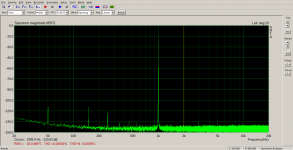
50mA: H1/H3 = -33.3/-66.5dBFS, THD=3.2%
100mA: H1/H3 = -33.4/-69.3dBFS, THD=2.2%
150mA: H1/H3 = -33.4/-72dBFS, THD=1.9%
With this "crossover THD magnifying glass" it can be seen that crossover distortion indeed drops continuously with increasing bias current. There is no "sweetspot" around 100mA bias but minimal crossover THD will be achieved in a class A biasing. Assuming a loop gain of 80dB/1kHz I would expect THD at the output to drop to 0.32/0.22/0.19 ppm - theoretically.
In fact I measured 10~12ppm THD while bias setting did not affect overall output THD. This is an indication that other distortion sources were masking crossover distortion.
Last edited:
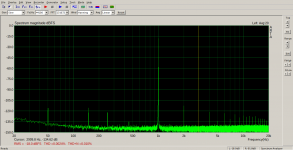
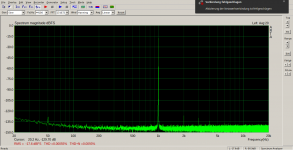
Going back to THD measurements at the amp output terminals. Measurements without load yield THD levels close to the loopback results, i.e. they are dominated by the soundcard being the bottleneck of resolution. By nature THD increases with load current. The worst case scenario here is a 5R dummy load.
THD rises from 0,00033% to 0,0022% with load. More insightful is the behaviour of the contribution of the first harmonics H2 and H3. While H3/H1 changes from -120dB to -117dB, H2/H1 jumps from -120dB to -95dB.
I conclude that most of THD is summed up by the even harmonics H2, H4, H6.. while the odd harmonics H3, H5, H7 contribute the minor part. I do correlate the odd harmonics to intrinsic crossover distortion (being the minor part) and the even harmonics to parasitic coupled supply ac-current passing through the bulk caps (as major part). Coupling may be magnetically or by some (tiny) ground loops.
When using a single soundcard as generator and analyzer with asymmetric i/o ground loops cannot be avoided. To break this ground loop I set up a second soundcard with its own laptop operating with its own battery separated from the mains supply.
Next step was rearranging with minimal physical displacement of equipment to the original setup with one soundcard for comparision.
Attachments

Last edited:
Obviously the separate circuits are beneficial in reducing high order harmonics. This confirms my previous assumptions - its all about physical layout!
Amendment to posting #63
Some explanations of the extended setup:
The main soundcard was an EMU tracker used for recording only, input connected to the output attenuator, output not connected.
The additional soundcard was EMU 0202 used as 1kHz signal source. Output level was set to -17dBFS which seems to be close to the sweetspot. Input was not connected. On both PCs I ran ARTA spectrumanalysis. Starting SA on the generator side without averaging delivers a continuous signal thus the amp may warm up some time. Then the analyzer part starts SA with 20avg and terminates when done.

Hunting "parasitic distortion" - i.e. distortion LTSpice does never show up. Which in reality is a lack of missing modelling and not the fault of LTSpice per se.
Focusing on supply current ripple as a source of even harmonics the blocking caps came into my mind. The pcb is populated with 220uF/63 which appears to be a tiny capacitance. My intentention was to direct the distorted audio ripple current mostly through the 2x4700u bulk caps close to the rectifier so these local caps carry only 1/20 of the ripple current. And I chosed polymer caps with their exceptional low ESR for best hi-frequency blocking. In fact their ESR outperforms any conventional 4700uF bulk cap. This fine theory assumes the bulk caps are placed close to the PCB thus keeping magnetic loops small. Looking at the current setup with the dual-voltage lab supply there is plenty room for improvement. To simulate the future layout I placed two caps 4700uF parallel to the connecting terminal block.
Focusing on supply current ripple as a source of even harmonics the blocking caps came into my mind. The pcb is populated with 220uF/63 which appears to be a tiny capacitance. My intentention was to direct the distorted audio ripple current mostly through the 2x4700u bulk caps close to the rectifier so these local caps carry only 1/20 of the ripple current. And I chosed polymer caps with their exceptional low ESR for best hi-frequency blocking. In fact their ESR outperforms any conventional 4700uF bulk cap. This fine theory assumes the bulk caps are placed close to the PCB thus keeping magnetic loops small. Looking at the current setup with the dual-voltage lab supply there is plenty room for improvement. To simulate the future layout I placed two caps 4700uF parallel to the connecting terminal block.
Attachments
The mystery of H2 distortion....
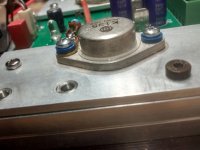
All in all there remained some unsatisfactory feeling that I have a problem with even harmonic distortion of unknown origin. So I checked different points of the circuit looking for some salient H2 levels. Reading out the H2-levels of the power MOSFET cases (connected to source!) revealed a difference of several dB - which gave me some real headache to understand.
You should know that both sources are connected to a wide copper plane resulting in a very low impedance. On the other hand these levels are in the range of several 10uV - and the full output current crosses this plane. What makes things worse here is the fact that both power MOSFETs are placed at opposite sides of the PCB so both sources are at distance of several cm apart.
And so we approach the real problem: Each MOSFET delivers a halfware of the signal and thus is a first class even harmonics source! Summing both MOSFETs cancels all this asymmetric distortion - theoretically. But with a closer look at very small distortions, the summing is perfect only at one single point of that plane at the connection to the feedback network. Moving away from that point along the plane halfwave balance degrades slighlty - but measureable. The situation is similar to a ground loop and the solution is the same: Current flow between both half waves must be steered away from the output plane through a separate path connecting both sources directly. Thus the summing of the halfwaves takes place outside the output plane. Otherwise the plane is "poisoned" with a voltage gradient along its area. And this separate path must be connected by ONE SINGLE tap with the output plane.
Another option is connecting the power output as close as possible to the feedback entry point.
Did I mention "it is all about layout" yet?
Last edited:
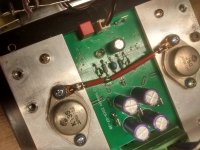
This bypass constisted of a single wire connected by a big soldering blob to the output plane next to the feedback network input. This does not look like a perfect tap point, so I replaced the wiring by a "perfect" tap.
Attachments
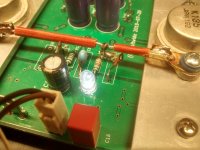
And, there is a measurable difference!
Comparing the ARTA plots of the above measurements shows a further reduction of H2 (7dB) and THD.
I have to admit that these examinations of H2-distortion resulted in an insight new to me until now.
In the old days such high resolution measurements were not available to the amateurs -
with low-cost usb-soundcards this is a cake today.
And I was surprised by the tiny mods yielding measurable results - this is real physics!
Attachments

Last edited:
thank you for the nice wordings. My goal is to squeeze performance close to the physical limits and understand the underlying details - and demystifying strange effects along this route.impressive detective work!
mlloyd1
@voltwide,
What is this procedure to get THD/harmonic information from your sound card?
Would you recommend one program over another?
The place I'm currently interning at has a few AudioPrecisions and I can use those (fortunately) for something I'm currently building, but I'm intrigued at this approach and wondering what kind of information the sound card I have at home could produce.
@voltwide,
What is this procedure to get THD/harmonic information from your sound card?
Would you recommend one program over another?
The place I'm currently interning at has a few AudioPrecisions and I can use those (fortunately) for something I'm currently building, but I'm intrigued at this approach and wondering what kind of information the sound card I have at home could produce.
I use USB soundcards EMU-0202, EMU-tracker and in the past the Behringer UCA-202. But there are many others available on the market. Any good 24bit USB interface will do. The line input is routed through an DIY attenuator (30dB) to the amp output. And the line output is the signal source feeding the amp input. What you need is an analyzing software. Like many others here I use ARTA. With ARTA on your PC your soundcard becomes "poor man's AP". The screenshots here in this threat were obtained by using ARTAs spectrum analysis.
I hope this short summary is of any help, you will find more information inside measuring equipment threads. Another popular software is REW. I never tried that because ARTA has become the swiss army knife of audio measurements for me.
Last edited:
I have to correct posting #73. As I forget to set the cursor to 2kHz the value of -129dB related to 20.2Hz, i.e. this is a misreading. I shall repeat this measurement later.
Last edited:
I will take a look at ARTA. Thanks for the suggestions, awesome metalwork too, I'm taking a stab at drilling and tapping my first heatsinks in a couple days (with some help) and it's cool to see all the custom metalwork that goes on in these threads.I use USB soundcards EMU-0202, EMU-tracker and in the past the Behringer UCA-202. But there are many others available on the market. Any good 24bit USB interface will do. The line input is routed through an DIY attenuator (30dB) to the amp output. And the line output is the signal source feeding the amp input. What you need is an analyzing software. Like many others here I use ARTA. With ARTA on your PC your soundcard becomes "poor man's AP". The screenshots here in this threat were obtained by using ARTAs spectrum analysis.
I hope this short summary is of any help, you will find more information inside measuring equipment threads. Another popular software is REW. I never tried that because ARTA has become the swiss army knife of audio measurements for me.
To steer away output current flow from the inputs I moved the speaker output jack from the front to the rear panel.
It is evident that H2 distortion levels are sensitive to the wiring, every tiny imbalance destroys the result. Having said this my measured distortion levels are not engraved in stone and may be taken by a grain of salt.
Rewiring the amp I encountered a strange problem. THD was a factor 10 worse than before, even without loading. It turned out that some dirt or aluminium residuals build a resistive bypass inside the TO-3 screwing of 2SK135. Thorough cleaning of holes and insulating parts fixed that problem.
Measurement now resembles the ones before.
As a result H1/H2 = -17.6 -(-124.4) = -116.8dB is not too bad.
Attachments

Last edited:
- Home
- Amplifiers
- Solid State
- Just another lateral FET amp