Yes, the klippel current sensor is good but it also isn't perfect. Check out this result where it decided BL protection was 26mm and it peaked at 45mm. 😳Kippel is actually tracking the driver movement with very high accuracy in real time to be able to control in a way to put the protections in place. Compare to this sort of tracking Dats DC offset model - though a gr8 idea seems to be far behind.
I find the stability tests really a good example.Yeah, there is a lot of data to look at in the database to be able to determine if your results are good or if they are not. I have had some professionals tell me early on not to share klippel data unless necessary, because of the risk of it being misread or misinterpreted and for that to spread as if it were legit data. Not saying that's what is happening in this thread; it's just one of the lessons I learned early on.
Which are never ever shown online. (or in test reports)
But I have seen drivers that looked fine on paper at first glance.
Unless you dive into the stability tests, and oh boy they were NOT doing so well!
If you know a thing or two how compliance behaves vs excursion, you also very quickly know that all Kms(x) graphs are far to simplified.
In this case we don't even take production quality in mind.
Some drivers looks great on paper, until you start to test them in bigger numbers.
The deviation is all over the place.
I seriously don't understand why there is no hardware one-shot trigger on the output of the sensor with a threshold that can be programmed.Yes, the klippel current sensor is good but it also isn't perfect. Check out this result where it decided BL protection was 26mm and it peaked at 45mm. 😳
I've tested this with mine, and it's pretty bullet proof.

Yep, even in LSI you can see this!If you know a thing or two how compliance behaves vs excursion, you also very quickly know that all Kms(x) graphs are far to simplified.
Oh yes, I wasn't talking about that just yet.Yep, even in LSI you can see this!
I was talking about these kind of things:
But parameter stability vs time, temperature and power is a whole other can of worms!!!!
Some drivers really struggle to hold a constant compliance over time (or temperature)
Talking about stability, this is the issue of the driver I was talking about before:
This doesn't show up with just LSI.
Anyway, this all shows that there's a lot more to consider.
Therefor I have my doubts about certain critique on certain test methods.
Not because critique shouldn't be allowed, but I don't find the arguments behind it all that convincing. (mostly far to simplified)
Based on my own experience, as well as experience from others.
Therefor I have my doubts about certain critique on certain test methods.
Not because critique shouldn't be allowed, but I don't find the arguments behind it all that convincing. (mostly far to simplified)
Based on my own experience, as well as experience from others.
First thanks! Nice to see some great work. I never found that a tapered pole was that useful. I have the prototypes made and we test the B up and down the gap. Where I agree that there are quirks in the simulations. For the most part I have compared FEMM 4.2 simulations to some truly expensive software. And it was close enough that manufacturing tolerances were the real differentiator.In all of the simulated BL curves of my underhung designs, there seems to be a rearward bias in FEMM results that is actually not there in real life. I tried tapering the pole around .015" smaller in diameter from the top of the gap to the bottom, and this will let FEMM spit out a flat BL curve, but after testing a prototype this way that is not the case. If you flip the polarity of your magnet 180 in FEMM and change the current of your VC circuit to -1, it will bias the BL towards the outward stroke.
Also, the chamfers on the corner of the top plate won't alleviate the "cat ear" B plot; that does not translate to real world results. Undercutting the pole for the gap height helps here, and with a flared taper at the top of the pole ID instead of just a radius you do not need an extended pole. Flux is less likely to stray/modulate from steel the more saturated it is, so saturating your pole fully at the gap is a good way to control the fringe field.
Here is a cutaway of one of my early designs with the FEMM result overlaid transparent on one half to show the saturation at the pole that I am talking about. In this exact design, FEMM showed a rear bias on the BL curve but the klippel measured it perfectly flat and symmetric.
Cat ear and all, no this was not a fully cooked design. I can't post the final version it is for a client. So Iposted something that showed the truth in the real worked that many drivers have a bias in the inward direction. Many as in about 95% of them. Balancing that out is truly where the men are separated from the boyz.
What software are you using to make your simulations?
I might turn to ELMER, if it begins to behave itself a little better. FEMM models in 3D but displays in 2D Elmer will do both. More useful for planars that I design sometimes. Normal drivers it really doesn't matter.
As for is FEMM accurate I have a thesis paper that chased that exact question, also regarding the multi Kilobuck Ansys and COMSOL. Given that COMSOL, and Z88 and CALCULIX are all based on the same math when a model is treated correctly in the two open source solvers you get the same answer as you get in COMSOL. I'm independent. Paying for that software is not in the realm of possibility. I guard my independence carefully and enjoy the freedom from those choices. It also means that at times I have to do other work to pay the bills. But, I have no office politics. My work stays as mine. And I get to work with some really interesting people in the industry one on one.
There are a few companies that are highly mechanized. Faital Pro, RedCatt, Focal. The majority of companies make drivers with such a wide variation in parameters that there is little to no QC that could be regarded as tight. Thankfully attention to a few key areas can make for a reasonable repetative set of driver parameters.Impossible to robotize.
Robotizing things only works when the prompter knows what he wants.
Guess what?
The very vast majority of my clients don't (exactly) know what they want.
They say A, mean B, we talk about C but they actually need Z.
After doing this for a while you can an additional sense for this.
Even more so for the grey areas in between.
The issue is that it is purpose built and DC capable with known attenuation towards 0Hz. Random PA amps, not do much. Not that they would not exist, but we'd need to chop off majority of them already. I understand the pros and cons and the outcome is that I'm not going to do that. Anyone else can feel encouraged.That's oversimplifying the issue.
There are plenty of companies with products that give a list of recommendations.
If it's gonna be community/DIY based, there will be also another list of recommendations.
(In fact, even Klippel has a list of recommendations in their documentation).
On top you can give a list of minimum requirements.
This is personally also the biggest critique I have at the Dayton system.
Why on earth do you want to compete with amplifier manufactures out there?
You will never ever reach that amount of quantities, therefor the price will always be less optimal.
Make no sense, plus it make the product unnecessarily expensive.
Additionally, it means that if that part breaks (which is far more likely compared to the other parts), the entire system won't work anymore.
Besides, I highly doubt about their quality as well.
@hurrication
Blmin 51.3(30) %
Cmin 31.2(30) %.
I Bow under your tester knowledge arguments, but it makes the revelation of things somewhat worse - those limits do not add up favourably to the graphical outputs, and even with limits in place, that should not stop the data of the speaaker being fairly correct. So the 18DS115's Bl behavior still looks unexplainably suboptimal.
Some stuff is more eyeopening though.
For the 18DS115:In the report you have, under the Table States section, what does it say in the BLmin% and Cmin% fields? It will have an entry that is formatted like: 70 (70) %. The first number is what the test has resolved to (unrelated to protection), and the number in parentheses is the protection percentage that you set at the beginning of the test.
Blmin 51.3(30) %
Cmin 31.2(30) %.
I Bow under your tester knowledge arguments, but it makes the revelation of things somewhat worse - those limits do not add up favourably to the graphical outputs, and even with limits in place, that should not stop the data of the speaaker being fairly correct. So the 18DS115's Bl behavior still looks unexplainably suboptimal.
Some stuff is more eyeopening though.
The amp doesn't need DC capabilities, only the ADC does?The issue is that it is purpose built and DC capable with known attenuation towards 0Hz. Random PA amps, not do much. Not that they would not exist, but we'd need to chop off majority of them already. I understand the pros and cons and the outcome is that I'm not going to do that. Anyone else can feel encouraged.
AI helping?The amp doesn't need DC capabilities, only the ADC does?
Regarding the original idea of the Amp requiring DC.
uh?AI helping?
Regarding the original idea of the Amp requiring DC.
This. AI assisted discovery?The issue is that it is purpose built and DC capable with known attenuation towards 0Hz.
Oh you mean if this statement was made from a AI?This. AI assisted discovery?
I don't know, lol
I don't think it's wise to use AI this way in general.
Gets murky very quickly.
Not at all.This. AI assisted discovery?
https://www.daytonaudio.com/product/2090/dats-la-loudspeaker-analyzer
It says it right in the description.
It is hard to argument when there is failure to read and responses are made on ones own assumptions. Probably time to stop talking to a wall. Cya everybody....
It’s hard to have a meaningful discussion on the topic when the basic principles of such systems aren't well understood.It is hard to argument when there is failure to read and responses are made on ones own assumptions
Which, again, is totally okay, everyone has different backgrounds and levels of experience.
But when a certain tone is set, it’s only natural to expect a similar tone in response.
Again, all of this is very well documented by Klippel as well as guys like Novak.
And if you dive really deep, you'll find quite some papers from B&K as well 🙂
With all due respect to Dayton, these sources rank quite a bit higher on my list when it comes to trustworthiness.
Estimating real cone excursion from DC pulses is a bit so-so to begin with btw.
I had the opportunity to borrow a DATS LA at the weekend and take some measurements. Again I used the Visaton AL130 mentioned in post 92 as DUT. Parallel to the DATS measurements, I also ran a triangulation laser for the excursion measurement. Below please find the results.
It appears that the deflection calculations from DATS LA are only correct in the somewhat extended linear range. In addition, the superimposed sweep for the parameter measurements does not always seem to be stable.
I will see if I can borrow the DATS LA again and carry out some further tests.
Regards
Heinrich
Attachments
Last edited:
The first short test with the Dayton DATS LA left a number of questions unanswered, so I borrowed the DATS LA again for a weekend.
The first thing I had to consider was how DATS LA calculates the excursion from the measurement data. As the signal for generating the excursion or operating point is very low frequency according to the patent, the following relationship should apply:
X = BL * I * Cms or
X = BL * U/Re *Cms
To check this, I measured the excursion in parallel with the DATS LA measurement routine using a trianagulation laser. In order to test the DATS LA, I selected various drivers as measurement objects, from vintage drivers (Monacor SPH 130) to modern PA drivers (Faital 12PR320).
First of all, I tried to determine from the measurement data how DATS LA calculates the excursion. In principle, the above formula applies:
X(DCV) = BL(DCV) * DCV / Re(DCV) * Cms(0)
With this calculation there is a reasonably acceptable agreement with the excursion values of DATS LA.
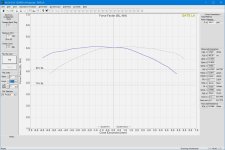
After the first measurements my assumption from post 159 was confirmed, the excursions shown by DATS LA are obviously only valid in the slightly extended linear range. Outside this range, the deviations become increasingly larger. Here are a few examples (DCV vs deflection).

Fig. 01 Wavecor WF182DB10

Fig. 02 Faital 12PR320
The blue line represents the DATS LA result, the red dashed line the result calculated with the above mentioned formula and the black dotted line the result corrected with the laser measurement.
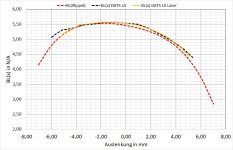
The deviations in the excursion range naturally have an effect on the further results. As an example, here are a few results for BL(x). The blue line represents the DATS LA measurement and the red line the result corrected by laser measurement.

Fig. 03 Wavecor WF182BD10

Fig. 04 Faital 12PR320
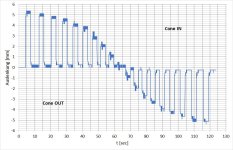
Furthermore, as already mentioned by Clark, it is of course inevitable that the voice coil heats up during the measurement. Here are two examples.

Fig. 05 Wavecor WF182BD10

Fig. 06 Faital 12PR320
DATS LA probably tries to take this into account during the measurement by using pause times of different lengths, but it is questionable whether this is always successful.

Fig. 07 Wavecor WF182BD10

Fig. 08 Faital 12PR320
Furthermore, the measurement routine results in an offset, which also has an effect on the result.

Fig. 09 Scan Speak 15W8434G00

Fig. 10 Faital 12PR320
Unfortunately, the programming of DATS LA is so fixed with regard to the symmetry measurement that no adjustment is possible.
Based on these results, I would not buy DATS LA. With the DUMAS-like method I mentioned above, you can achieve comparable, if not better, results, albeit with a little more effort. And the material investment is limited to an electric air pump for around €20 and a suitable housing.
Regards
Heinrich
The first thing I had to consider was how DATS LA calculates the excursion from the measurement data. As the signal for generating the excursion or operating point is very low frequency according to the patent, the following relationship should apply:
X = BL * I * Cms or
X = BL * U/Re *Cms
To check this, I measured the excursion in parallel with the DATS LA measurement routine using a trianagulation laser. In order to test the DATS LA, I selected various drivers as measurement objects, from vintage drivers (Monacor SPH 130) to modern PA drivers (Faital 12PR320).
First of all, I tried to determine from the measurement data how DATS LA calculates the excursion. In principle, the above formula applies:
X(DCV) = BL(DCV) * DCV / Re(DCV) * Cms(0)
With this calculation there is a reasonably acceptable agreement with the excursion values of DATS LA.
After the first measurements my assumption from post 159 was confirmed, the excursions shown by DATS LA are obviously only valid in the slightly extended linear range. Outside this range, the deviations become increasingly larger. Here are a few examples (DCV vs deflection).
Fig. 01 Wavecor WF182DB10
Fig. 02 Faital 12PR320
The blue line represents the DATS LA result, the red dashed line the result calculated with the above mentioned formula and the black dotted line the result corrected with the laser measurement.
The deviations in the excursion range naturally have an effect on the further results. As an example, here are a few results for BL(x). The blue line represents the DATS LA measurement and the red line the result corrected by laser measurement.
Fig. 03 Wavecor WF182BD10
Fig. 04 Faital 12PR320
Furthermore, as already mentioned by Clark, it is of course inevitable that the voice coil heats up during the measurement. Here are two examples.
Fig. 05 Wavecor WF182BD10
Fig. 06 Faital 12PR320
DATS LA probably tries to take this into account during the measurement by using pause times of different lengths, but it is questionable whether this is always successful.
Fig. 07 Wavecor WF182BD10
Fig. 08 Faital 12PR320
Furthermore, the measurement routine results in an offset, which also has an effect on the result.
Fig. 09 Scan Speak 15W8434G00
Fig. 10 Faital 12PR320
Unfortunately, the programming of DATS LA is so fixed with regard to the symmetry measurement that no adjustment is possible.
Based on these results, I would not buy DATS LA. With the DUMAS-like method I mentioned above, you can achieve comparable, if not better, results, albeit with a little more effort. And the material investment is limited to an electric air pump for around €20 and a suitable housing.
Regards
Heinrich
Last edited:
- Home
- Loudspeakers
- Subwoofers
- Is there a DIY technique to measure the BL curve of a woofer?