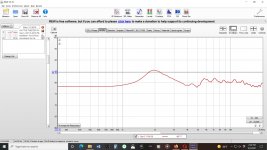
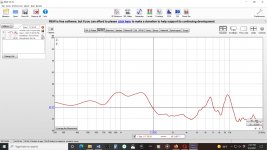
This is the raw response measured in-cabinet at 1m for the tweeter and woofer. The data has a 4ms gate and is not smoothed and should be good to 250Hz. The tweeter has a 22uF cap on it. The woofer is full range. The port is plugged.
I believe cutting off the woofer sooner means increasing the inductor value, which does lower the 1-2KHz range hump, but also lowers the valley at 700 Hz to the 65 dB level. This value in the crossover splits difference of the dip and hump at 700 Hz and 1000-2000Hz.
I believe cutting off the woofer sooner means increasing the inductor value, which does lower the 1-2KHz range hump, but also lowers the valley at 700 Hz to the 65 dB level. This value in the crossover splits difference of the dip and hump at 700 Hz and 1000-2000Hz.
Attachments
I was talking about the capacitor.I believe cutting off the woofer sooner means increasing the inductor value,
Try *.zip it.XSim dxo file seems to large to upload.
Great.
Now to find the range for the crossover. Where should the woofer be cut, where is its breakup?
Do you have a datasheet? Tweeter as well...
Now to find the range for the crossover. Where should the woofer be cut, where is its breakup?
Do you have a datasheet? Tweeter as well...
These are cheap chinese drivers, the tweeter 1" mylar and the woofer 4" paper cone and stamped basket. I did take measurements using REW and UMIK-1. These are the frd and zma files. The zipped files are txt needing an frd extension. The unzipped txt files are really zma files, system prohibited me uploading them with that extension for some reason.
Attachments
I don't have much confidence in those files. It might help to explain why the crossover seems difficult to achieve on the simulator.
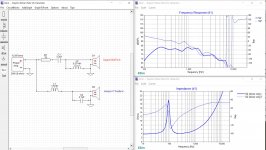
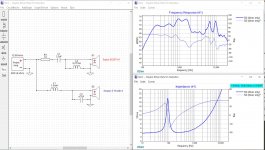
Ok, I figured out how to correct the issue with REW creating frd files other programs can't work with, so here are the frd and zma files for the Dayton ND20TA-6 tweeter and stock woofer for this speaker. The tweeter phase looks a little funny, but I went ahead and used XSim to create what appears to the untrained eye, an acceptable crossover, hopefully better than a 2.2uF cap on the tweeter. The values in this simulation are what I have on hand and should be able to get it in tomorrow to see how it measures and sounds.
Attachments
Last edited:
I cannot see tweeter phase on your screenshot. Try turning on the individual drivers, add phase to the plot, remove system phase, push them up the scale and spread out a little vertically.
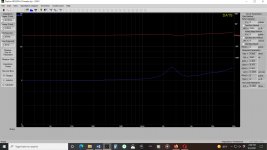
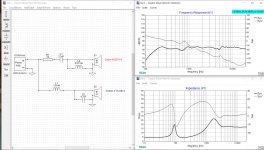
Hopefully, this satisfies your request. There are two choices to display phase in XSim from S1 and S1 Drive Only for the tweeter. Not sure what the difference is. Provided both. What do these plots tell us? Thanks!
I have not measured z offset yet, so this crossover does not account for it.
I have not measured z offset yet, so this crossover does not account for it.
Attachments

Last edited:
If you could post your *.dxo file (save the Xsim crossover and attach it), I will explain why this is helpful.

Hi, are there any sections on this thread that give guidance on how to do a low-pass and high-pass filter for the midrange in a 3-way? When I play around in WinPCd, it's not so easy to get a clean curve for the midrange vs a single low-pass like in a 2-way, cause the component values for one leg seem to affect the response from back to front.
Could you post the frd file for the mid.
What response are you looking for and what do you mean from front to back?
What response are you looking for and what do you mean from front to back?
Thanks, Allen! I'm a novice; just exploring filter creation using an Audax driver using the instructions in the woofer and tweeter posts, but got stumped when trying to do a midrange filter.
Here is the datasheet, the FRD traced from it, and the ZMA
The best I could do
 so far - the frustrating thing is when one filter looks good, it gets mangled when I adjust values of the components in the other filter, e.g. the low pass inductor moves the whole curve, so it ends up a random button mashing cause I don't understand how things are really working.
While I have you, is it even necessary to completely model a target curve as far as one could, or is it only important to trace the part of a curve near the crossover frequency itself? Thanks!
Here is the datasheet, the FRD traced from it, and the ZMA
The best I could do
While I have you, is it even necessary to completely model a target curve as far as one could, or is it only important to trace the part of a curve near the crossover frequency itself? Thanks!
Last edited:
Tracing the whole curve can help because the other part of crossing is the overall balance.. you need to be sure the response around the crossover is at the right level compared to everything else.
You may also want to tilt the whole response slightly. You may also need to make a judgement regarding the baffle step, to make sure you include those extra dBs (up to 6).
Of course the traced responses also don't include the effect of the box resonance on the bass, however you can typically make a guess there when trying to visualise the overall balance.
I'll look at your filter..
Ok, the first thing I want to say is about the resistances marked next to the capacitors and inductors. If you don't plan to have resistors right next to these components then you should leave them at their default values (less than 0.1 for capacitors and between approximately 0.2 and 1 for inductors).
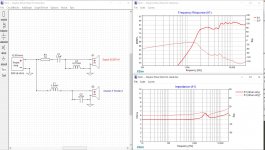
The next thing is the bump at 4kHz. This is a breakup mode, it is only an issue directly in front of the speaker. Either toe the speaker (turn it a few degrees) or cross faster or lower. However if you still need it gone, add a notch filter.
How does this look?
The next thing is the bump at 4kHz. This is a breakup mode, it is only an issue directly in front of the speaker. Either toe the speaker (turn it a few degrees) or cross faster or lower. However if you still need it gone, add a notch filter.
How does this look?
Attachments

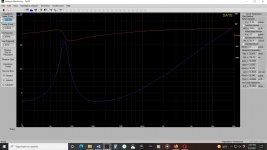
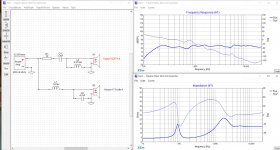
This is how it might look after post #929. You ask what driver only is, you can see the before and after crossover at the same time. You ask what the plots tell us, can you be more specific or do you mean in general?
I put together that crossover based on the basic 2nd order layout and mostly driven by the availability of the 1.5mH inductor. From what I have gathered, the crossover point for the woofer should be no higher than half the frequency of the breakup, defined by the peak at 6500Hz, so 3250Hz. For the tweeter, the crossover point should be no lower than half the peak impedance of 4500Hz, so 2250Hz. These ranges for a crossover point to pick do not overlap, creating a problem if it is necessary to have the same crossover point for both drivers. This seems mostly driven by poor extension of the woofer.
Just some questions:
On this crossover, what are the crossover points of the woofer and tweeter?
What does the phase information tell us about this crossover parts selection? Are more parts needed to correct phase issues if they exist and what would they be?
I see that PCD picks some textbook values based on a chose crossover point for each driver to serve as a starting point (and they don't seem to work well here), but I don't see how XSim gives you a head start if you have some crossover point goals (as stated above using rules of thumb). So how does one define a starting point when designing a crossover using XSim?
I'll answer these one at a time..
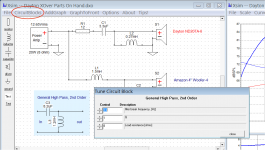
You can create an extra blank (default) driver and put these blocks on it to make it a target curve.
See the attachment, you can load a circuit block. When you tune it you can set the frequency and Q factor (0.5=LinkwitzRiley). This is a starting point and needs tuning with a real driver.I see that PCD picks some textbook values based on a chose crossover point for each driver to serve as a starting point (and they don't seem to work well here), but I don't see how XSim gives you a head start if you have some crossover point goals (as stated above using rules of thumb). So how does one define a starting point when designing a crossover using XSim?
You can create an extra blank (default) driver and put these blocks on it to make it a target curve.
Attachments
- Home
- Loudspeakers
- Multi-Way
- Introduction to designing crossovers without measurement