Right click the diagram and select 'edit simulation' and from there select the 'Transient' tab.
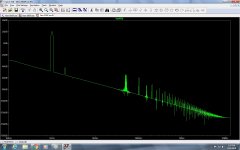
It was pointed out to me that my DC voltage source was upside down. Kind of like, "Sir, your fly is down." I found the problem. I had put the numdgt=12 and plotwinsize=0 in the transient command which Spice didn't like. When I removed it the graph came back. I've attached two more JPEG's. "FFT With" is with a specified time range.
Attachments
I see Mooly has helped you correct your problem, but as you can see, your .tran command (;tran 10ms) is commented out. A semicolon comments out a spice command. 😉I know how to do steps 1 & 2 with the graph but I'm not getting a graph. When I hit run I get the screen in the attached JPEG.
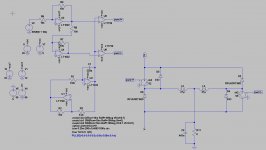
Hey Guys, on the question of a constant current source. I've read that a CCS has a high rate of ripple rejection and therefore has a high impedance to an AC signal. In Spice does the current object have the same effect? The reason I ask is that in the preamp when I change the value of the plate resistor for the second stage the gain changes. But if the CCS were actually a very high AC impedance it shouldn't should it? Does Spice see the CCS as high impedance to AC?
Yes. Spice CCS, by itself, is hi-z. Please note that in your circuit there's significant feedback from the second stage to the first.
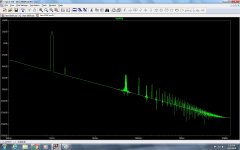
Thanks guys, your advice helped a lot. Again. I'm posting an FFT of the preamp design. While my question isn't specifically a Spice question it arises from Spice and should be easy to answer. The run is set at .5 volt input at 1k with a 30 volt output swing. My question is this, there is a large bump in distortion at 140k. Is that distortion parasitics? And is there way to eliminate it? Or does it even need to be eliminated?
You missed this?
http://www.diyaudio.com/forums/soft...ice-iv-beginner-advanced-106.html#post5353280
Jan
Jan, are you talking about Hans' graph? That's not my circuit. It was a known good circuit I was using to learn Spice.
When entering the data for an inductor do you have to enter all of it? I mean from what I know of series resistance and parallel resistance you have to measure those in the circuit don't you?
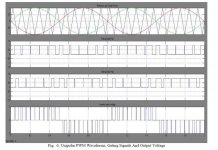
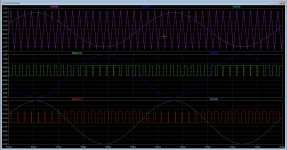
I try to model a unipolair class d amp, but it does not what I want, strange output signals for example and uge currents. looks like fases are wrong, see picture 1 and 2 for comparison. such a simple topologie and not see what is wrong, I shame myself.
maybe someone sees the problem and give hint, building schematic as with the paper, did not work, something needs to me done..
Maybe when I get tip, I see it, can be a slight small error, who most of the time is not seen. but I think it is signal input fases is wrong, putting the sinusoidal input not 180 Degree but in fase into the two comparators I get the signal you can see on pic 1 who is the right one.
i did see also some pieces where two in fase input sinusoidals but with one plus and one minus offset and placed inside a triangle is also used. mucho possibillities, but can it be simmed.
thanks.
Attachments
I have two LCR meters. One is a DER EE Japanese model that measures inductance at five different frequencies. And measures up to 2KH. Unfortunately EDCOR's data sheets don't provide much information.
For most simulation "bal-park'-figures will do fine, so use the "DER EE" get the series inductance and resistance and you are ready to go 🙂
Can anyone tell me if the output waveform is RMS volts? I think I remember seeing that in one of the threads but haven't been able to find it.
A transient plot is showing the instantaneous value of the waveform at a point in time. The RMS (root mean square) value represents the effective value of the waveform over the course of one complete cycle. A sine wave which is symmetrical above and below the X-axis will have an average value of zero, but such a sine wave voltage will still dissipate power in a resistor that is placed across it, just as though there was a DC voltage across that resistor. The RMS value of the AC voltage can be thought of as the equivalent DC value for the waveform. For a sine wave, the RMS value is the peak value divided by the square root of two (or the peak value multiplied by 0.707). You can determine the peak value of the waveform from the graph.
I should add that if there is a DC component to the sine wave (i.e., if it is not centered about the X-axis), that DC component will also add to the dissipation of a resistor placed across that voltage source.
I should add that if there is a DC component to the sine wave (i.e., if it is not centered about the X-axis), that DC component will also add to the dissipation of a resistor placed across that voltage source.
Last edited:
P/N FET models Rd and Rs
I hope someone else has noticed that the Rd and Rs model parameters seem to have been swapped. The following PJF and NJF models give exactly the same but complementary characteristics. This is LTSpice from a few gens back maybe it has been fixed. The errors are large for high Idss FET's.
.model NCH NJF(Beta=50.0m Vto=-.50 Lambda=37.300E-3 Rs=7.5000 Rd=1.0)
.model PCH PJF(Beta=50.0m Vto=-.50 Lambda=37.300E-3 Rd=7.5000 Rs=1.0)
LTspice XVII disabling waveform "drag" with Ctrl depressed?
I went ahead and installed the latest LTspice ("XVII") last night. For the most part, it looks and feels pretty much as the IV version.
One very irritating "feature" i've stumbled across, though, is that whenever the waveform plot window is highlighted, my mouse cursor is within its confines and i press down Ctrl (in preparation to click on the name of a waveform to have it measured), it drags the plots along
Then after i notice that, i have to let go of Ctrl and wait for the waveforms to get re-drawn, then re-zoom, then place the mouse cursor on the waveform name before pressing Ctrl then clicking on it.

The older version doesn't behave like that. Anyone have any idea if and how this can be disabled?
I went ahead and installed the latest LTspice ("XVII") last night. For the most part, it looks and feels pretty much as the IV version.
One very irritating "feature" i've stumbled across, though, is that whenever the waveform plot window is highlighted, my mouse cursor is within its confines and i press down Ctrl (in preparation to click on the name of a waveform to have it measured), it drags the plots along
Then after i notice that, i have to let go of Ctrl and wait for the waveforms to get re-drawn, then re-zoom, then place the mouse cursor on the waveform name before pressing Ctrl then clicking on it.
The older version doesn't behave like that. Anyone have any idea if and how this can be disabled?
I don't know of a way to disable the plot window from being dragged around but in reality its just 'different' rather than a problem imo. You soon get used to not pressing Ctrl until the cursor is clear of the viewing area.
Scott... I'm only running LTXVII these days but enlighten me 🙂 Where are the default (as in no type number) models located ? I can't seem to find them in LTXVII.
Scott... I'm only running LTXVII these days but enlighten me 🙂 Where are the default (as in no type number) models located ? I can't seem to find them in LTXVII.
It's just annoying as hell... Or rather, the annoying part is not being able(?) to change that "new" default behaviour. At least not that i could find yet, anyway.
The new model / symbol folders look like they're in Documents\LTspiceXVII\lib.
The new model / symbol folders look like they're in Documents\LTspiceXVII\lib.
- Home
- Design & Build
- Software Tools
- Installing and using LTspice IV (now including LTXVII), From beginner to advanced