Hi Ian, yes I did something similar, but don't know how to get 'kHz' on the X-axis instead of 'kV'. Not critical, but would be nice ;-)
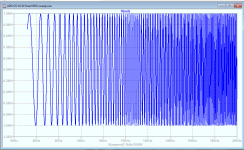
I also changed the FM input source to a PWL wave; using a Pulse here feels a bit awkward.
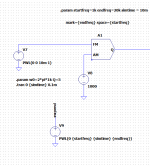
I'm setting the X-axis to V(swpend)*1kHz/1000V and it will show the frequency correctly.
Jan
I also changed the FM input source to a PWL wave; using a Pulse here feels a bit awkward.
I'm setting the X-axis to V(swpend)*1kHz/1000V and it will show the frequency correctly.
Jan
Attachments
Last edited:
I'm setting the X-axis to V(swpend)*1kHz/1000V and it will show the frequency correctly.
What a clever way to convince LTSPICE's axis labeling "automatic detection of units" code, that your axis is hertz instead of volts. Congratulations!!
Actually, I got idea after reading Ian's post above. But yes, it's nice to see it all come together!
Jan
Jan
As time can be used as part of your formula's (creating voltage sources) you can use something like this here (or any other non linear formula you prefer)


Hello all guys.
Is there a way to simulate a potentiometer (not rheostat)?
How do I simulate a log pot?
Many thanks in advance.
Is there a way to simulate a potentiometer (not rheostat)?
How do I simulate a log pot?
Many thanks in advance.
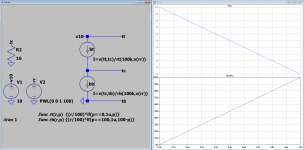
Here is a potentiometer, can be used with constants, or stepped, or voltage controlled as here.
v10 = psu
rr = potentiometer percentage as a voltage 0...100%
rt() formula for resistor at top
rb() formula for resistor at bottom
the formula input parameters are r=resistance, p=percentage
bt = resistor at top
bb = resistor at bottom
the resistors are created by using a current source, where i=v/r
tt, tc and tb are trimmer top, center and bottom
Have fun,
Just remember, Ohm's law solves most of your problems
p.s. the if(...) statement in .func rt(r,p) {(r/100)*if(p==0,1u,p)}
and .func rb(r,p) {(r/100)*if(p==100,1u,100-p)}
prevents zero Ohm as a value by substituting it (zero) with 1u
Attachments
Last edited:
Your graph clearly shows a LINEAR transition, not a LOG one.Here is a potentiometer, can be used with constants, or stepped, or voltage controlled as here
Here's a better transition.
But I cannot get LTspice to plot R (rotation %) versus voltage out. ????? Suggestions?
But I cannot get LTspice to plot R (rotation %) versus voltage out. ????? Suggestions?
Attachments
Last edited:
What if none of the extremes of the resistance nor the wiper is grounded? What I want to simulte is a Baxandall active tone stack. In these cases no grounded pin is available.
Last edited:
- Home
- Design & Build
- Software Tools
- Installing and using LTspice IV (now including LTXVII), From beginner to advanced