Haven't time to study it but there are problems around the AC detection. The relays are being driven by a 50Hz signal that seems to be coming from there.
Things I altered...
Add some series resistance to the relay setting, say 500 ohm.
Make the supply come up after a fraction of a second. Same for the AC signal.
Are the diodes the right way around across the relays? I'm getting a massive negative voltage here which means the clamping is no good.
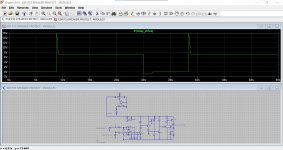
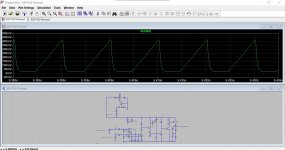
Node 2 in the sim is the output of the AC detector... its at 50Hz.
Things I altered...
Add some series resistance to the relay setting, say 500 ohm.
Make the supply come up after a fraction of a second. Same for the AC signal.
Are the diodes the right way around across the relays? I'm getting a massive negative voltage here which means the clamping is no good.
Node 2 in the sim is the output of the AC detector... its at 50Hz.
Attachments
Thanks for your replies.
I have changed the resistor to 100k, thanks MJ for pointing.
Now sim file runs ever so slowly (corrupted may be, ) just 16 seconds into the sim, spice has created 5.5Gb of .raw file, totally slowing down my pc.
To Mooly,
I will disconnect the ac detector part and see.
Edit: this how it looks... relay drive node should normally be at zero volts, when there is DC on amp, it should be at + volts. this is what I understand.
Attachments

Last edited:
I think the design is flawed, at least the basic building blocks are.
If you look at the AC detection circuit in isolation the time constant seems to small (1uF and 100k)... thinking aloud now... you only have one AC input, Rod has two which would give 100Hz rather than 50Hz. That makes a big difference.
So make it 100Hz for now and change the cap to 2.2uF. Still a bit AC'ish at the output but a lot better.
The .raw was large and the sim slow (educated guess now) because of all the micro data being generated by the inductive relay coils being partially AC driven by the flawed AC detect circuit.
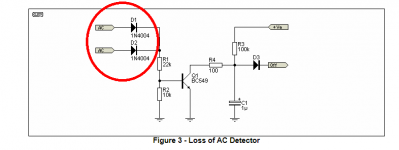
Use 1N914 or 4148 throughout. Clamping circuit now clamps. Zeners removed for now, that was Doug Self trick using Zeners but I think the circuit of Rods is wrong in that area. Actually it all looks a bit of a crib of Dougs.
If you look at the AC detection circuit in isolation the time constant seems to small (1uF and 100k)... thinking aloud now... you only have one AC input, Rod has two which would give 100Hz rather than 50Hz. That makes a big difference.
So make it 100Hz for now and change the cap to 2.2uF. Still a bit AC'ish at the output but a lot better.
The .raw was large and the sim slow (educated guess now) because of all the micro data being generated by the inductive relay coils being partially AC driven by the flawed AC detect circuit.
Use 1N914 or 4148 throughout. Clamping circuit now clamps. Zeners removed for now, that was Doug Self trick using Zeners but I think the circuit of Rods is wrong in that area. Actually it all looks a bit of a crib of Dougs.
Attachments
Mooly, it sounds like you might have forgotten that the transformer secondary swings many many volts, far more than 2.25V [ ((22K+10K)/10K)*Vdiode ].
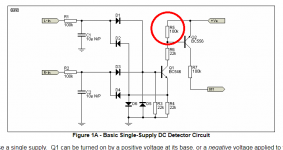
So when you install Rod Elliott's full wave rectifier instead of Prasi's half wave rectifier, you find that the "I am alive!" transistor (post #2761, Figure 3, Q1) is turned on and pulling down, for all but ~10% of each half-cycle of the AC mains sinusoid. Q1 only turns off in a narrow range of mains voltage surrounding the zero crossings. In 50 Hz countries, the off time is about 1 millisecond: 10% of 1/2 of (1/50Hz). However the time required for R3-C3 to pull node OFF upwards to a logic-1, is far far longer than 1ms; and so OFF remains low.
So when you install Rod Elliott's full wave rectifier instead of Prasi's half wave rectifier, you find that the "I am alive!" transistor (post #2761, Figure 3, Q1) is turned on and pulling down, for all but ~10% of each half-cycle of the AC mains sinusoid. Q1 only turns off in a narrow range of mains voltage surrounding the zero crossings. In 50 Hz countries, the off time is about 1 millisecond: 10% of 1/2 of (1/50Hz). However the time required for R3-C3 to pull node OFF upwards to a logic-1, is far far longer than 1ms; and so OFF remains low.
Thank you Mooly, for the trouble shoot.
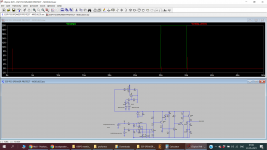
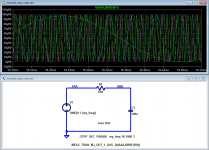
I changed all diodes to default 1n4148 and added 2 AC sources with 180 phase difference.
Also removed the zeners. added 4.7u cap for the AC. but mine still behaves like attched screen shot.
could you post your sim file.?
edit:
D12/D14 output is now positive half cycles... 2nd pic.
I changed all diodes to default 1n4148 and added 2 AC sources with 180 phase difference.
Also removed the zeners. added 4.7u cap for the AC. but mine still behaves like attched screen shot.
could you post your sim file.?
edit:
D12/D14 output is now positive half cycles... 2nd pic.
Attachments
Last edited:
Mooly, it sounds like you might have forgotten that the transformer secondary swings many many volts, far more than 2.25V [ ((22K+10K)/10K)*Vdiode ]....................
Thanks Mark, all I have done up to now was just take the original sim at face value and look why it wouldn't run. The AC input is 14v peak here (on the sim).
...............could you post your sim file.?
edit:
D12/D14 output is now positive half cycles... 2nd pic.
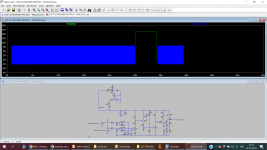
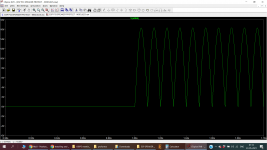
Here you go. Should just click and run but its probably not that much different at the moment.
The collector of Marks 'I'm alive' transistor looks like this.
Attachments
Often when I run a LT Spice XVII .step param simulation, I get a 1.#QNANA result in one or more of the steps, even though they may be very close together in value. I also find that the simulator sometimes does this with a fixed parameter, NOT stepped. Then if I change it by just a tad (~0.1, say), it will run fine. I don't understand this rather peculiar behavior. How do I avoid this?
Can I ask another question? I want to do a .tran with a frequency sweep to obtain a graph of dissipation in some parts as a function of frequency.
I know that a .ac uses a freq sweep*, but as far as I can see the dissipation measurement (the thermometer symbol) is not available in .ac runs.
I have played a bit with the SFFM voltage source but I'm not sure what that actually does. For instance, what are the units for the MDI modulation index?
Any ideas how to do a .tran freq sweep?
Jan
*Also, I think that whatever you set the AC value for a .ac to, it is still a small signal simulation only impacting the magnitude of the graph, but not actually exercising the circuit with that level.
Last edited:
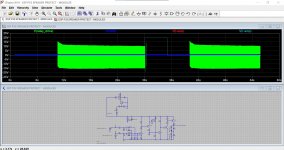
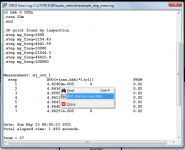
One method that works, is to have an LTSPICE "parameter" for frequency, that is used in all of your sinewave sources of a transient analysis. Then use LTSPICE's .STEP directive to perform numerous transient analyses at different frequencies. Use .MEASURE statements to extract the result(s) you are interested in, here I guess it's (average_voltage * average_current). Then plot the .MEASURE results by right-clicking in the "View Error Log" window. See figure1 below.
You can get a visual confirmation that your .MEASURE expression is correct, by simply plotting that expression when the stepped transient analysis completes. See figure2 below.
_
You can get a visual confirmation that your .MEASURE expression is correct, by simply plotting that expression when the stepped transient analysis completes. See figure2 below.
_
Attachments
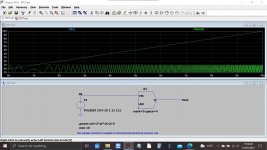
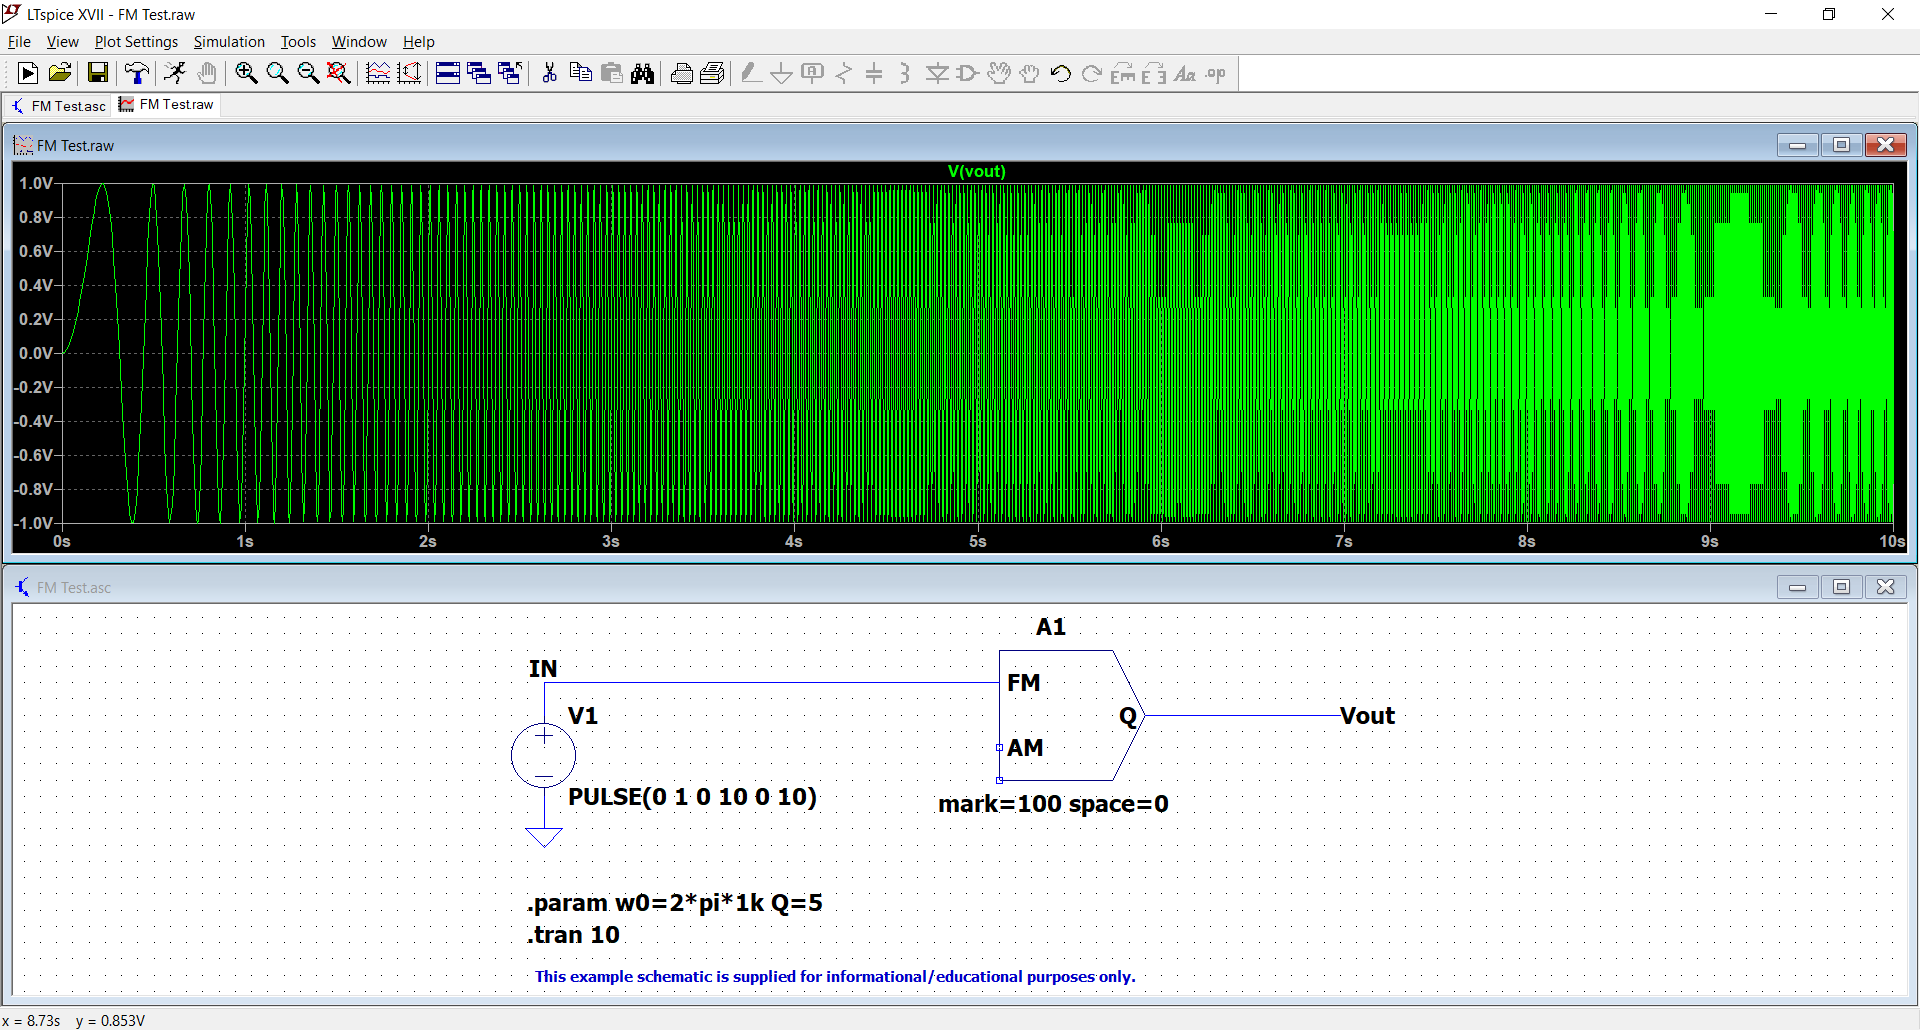
I got curious looking if it was possible to do a frequency sweep and found the PLL example included with LT. Severely modified it needs someone with more understanding of what the various commands mean.
The mark/space ratio seems to set min and max frequency. I'm not sure why it does what it does in the 0 to 1 volt control voltage region either...
Someone might like a play.
The mark/space ratio seems to set min and max frequency. I'm not sure why it does what it does in the 0 to 1 volt control voltage region either...
Someone might like a play.
Attachments
One method that works, is to have an LTSPICE "parameter" for frequency, that is used in all of your sinewave sources of a transient analysis. Then use LTSPICE's .STEP directive to perform numerous transient analyses at different frequencies. Use .MEASURE statements to extract the result(s) you are interested in, here I guess it's (average_voltage * average_current). Then plot the .MEASURE results by right-clicking in the "View Error Log" window. See figure1 below.
You can get a visual confirmation that your .MEASURE expression is correct, by simply plotting that expression when the stepped transient analysis completes. See figure2 below.
_
OK, yes I get what you are saying. To plot the dissipation in an active device (tube in this case) the power expression gets complex, but I probably can just use the 'thermometer' probe after the simulation ends, instead of the .meas approach.
Let me check this out, thanks for the hint!
Jan
I got curious looking if it was possible to do a frequency sweep and found the PLL example included with LT. Severely modified it needs someone with more understanding of what the various commands mean.
The mark/space ratio seems to set min and max frequency. I'm not sure why it does what it does in the 0 to 1 volt control voltage region either...
Someone might like a play.
Yes, I wish there was some explanation.
Jan
The circuit element is supposed to be used with an input of 0 (space value) to 1V (mark value).I got curious looking if it was possible to do a frequency sweep and found the PLL example included with LT. Severely modified it needs someone with more understanding of what the various commands mean.
The mark/space ratio seems to set min and max frequency. I'm not sure why it does what it does in the 0 to 1 volt control voltage region either...
Someone might like a play.
Generally, for positive modulation the mark value is greater than the space value, but the opposite is possible.
I never experimented values outside the 0-1 interval, but apparently LTspice still handles them in a coherent way.
Thanks Elvee. I've a had a good play with altering all the parameters but tbh couldn't make much sense of it.
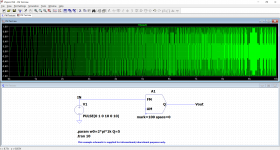
A control voltage from 0 to 1 volt seems to give high to low frequency sweep while from 1 to 10 gives low to high. Making the 'space' ever larger pushes up the high frequency point but only up to a point. These are with 0:400 M/S
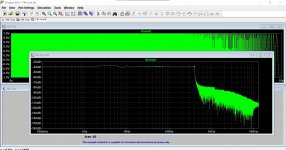
FFT's are funny to look at. Here is 0 to 1v control and 1 to 10.
A control voltage from 0 to 1 volt seems to give high to low frequency sweep while from 1 to 10 gives low to high. Making the 'space' ever larger pushes up the high frequency point but only up to a point. These are with 0:400 M/S
FFT's are funny to look at. Here is 0 to 1v control and 1 to 10.
Attachments
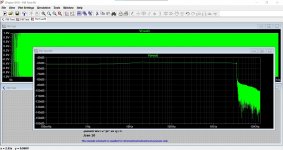
When used in the intended way, it yields the expected results.
Here, the frequency is swept from 0Hz (space value) to 100Hz (mark value).
It may do funny things when used outside its normal parameter range, but I don't think it presents a great interest.
The FFT looks normal for a very slow frequency sweep
Here, the frequency is swept from 0Hz (space value) to 100Hz (mark value).
It may do funny things when used outside its normal parameter range, but I don't think it presents a great interest.
The FFT looks normal for a very slow frequency sweep
Attachments
There is also the interaction with the ramp input signal. The example is set for a 10sec sweep but that can also be changed as needed.
Then it is best to set the .tran duration to 2x the ramp time.
Attached a 1k to 10k sweep.
Edit: this is a Special Function symbol, works as follows:
The MODULATE device is a voltage controlled oscillator. See the example schematic .\examples\Educational\PLL.asc. The instantaneous oscillation frequency is set by the voltage on the FM input. The conversion from voltage to frequency is linear and set by the two instance parameters, mark and space. Mark is the frequency when the FM input is at 1V and space is the frequency when the input is at 0V. The amplitude is set by the voltage on the AM input and defaults to 1V if that input is unused (connected to the MODULATE common).
Jan
Attachments
Last edited:
Thanks guys 🙂 It is curiosity value only at this stage. The .param line was a carry over from the original circuit and can be deleted.
Jans implementation comes close to what I was trying to do and I see now how to get a 20 to 20k sweep. I think its uses are limited here though.
Jans implementation comes close to what I was trying to do and I see now how to get a 20 to 20k sweep. I think its uses are limited here though.
My purpose was to visualize the increase in output device dissipation with a cap load and increasing freq. This works now as I want, and I can now quantify in a nice graph how that changes.
I also managed to make the X-axis show the frequency, albeit not in kHz but in kV. Can't win them all I guess ;-)
Thanks for all the help putting me on this trail.
Jan
I also managed to make the X-axis show the frequency, albeit not in kHz but in kV. Can't win them all I guess ;-)
Thanks for all the help putting me on this trail.
Jan
Attachments

Here's another way to show frequency on X-axis. But it only does one decade, here 1kHz to 10kHz. I added a demo RC LPF.
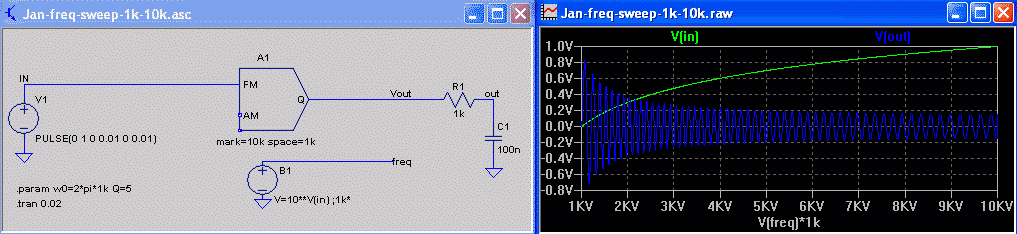
Plot X-axis using "V(freq)*1k"
This puts "freq" in the 1-2 volt range. Avoid scaling in the Bsouce giving 1-2 kV range - it can slow simulations.
Plot X-axis using "V(freq)*1k"
This puts "freq" in the 1-2 volt range. Avoid scaling in the Bsouce giving 1-2 kV range - it can slow simulations.
Attachments

- Home
- Design & Build
- Software Tools
- Installing and using LTspice IV (now including LTXVII), From beginner to advanced