Yes, but you can't drop the text onto the schematic that way.Just put the cursor over the body of the component and the cursor image will turn from a scope probe to a clamp on current meter.
Okay sorry I missed that you were trying to put it on the schematic I never do that so I'm not sure.
tommost
tommost
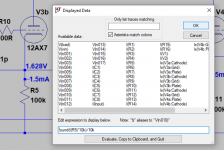
Try this to place the current or voltage value next to a component on the schematic:
Right click on the schemetic, go draft, then .op data label.
Place the field next to the component on the schematic.
Right click on the field and then select the component eg I(R1) or V(R1) from the list and make sure to delete the $ from the field.
Right click on the schemetic, go draft, then .op data label.
Place the field next to the component on the schematic.
Right click on the field and then select the component eg I(R1) or V(R1) from the list and make sure to delete the $ from the field.
Should we be archiving the LT installer just in case...
I suppose this explains why the last few time I have raised any feedback issues via the LT built in feedback options I now just get a corporate message saying please supply company/university details/location/phone etc. I gave up bothering.
I suppose this explains why the last few time I have raised any feedback issues via the LT built in feedback options I now just get a corporate message saying please supply company/university details/location/phone etc. I gave up bothering.
Good idea.
I have the current version, Apr 2020, and the previous one, Nov 2019.
Any one cares to maintain a full version history? I never have any issues with the updates, but I see complains from time to time.
I have the current version, Apr 2020, and the previous one, Nov 2019.
Any one cares to maintain a full version history? I never have any issues with the updates, but I see complains from time to time.
Should we be archiving the LT installer just in case...
I would in any case save the model libraries! Imagine a perfect Spice but no models ;-)
Jan
LTSpice is until now the best Spice I have used. Its algorithms are fast and safe. I like it very much.
Hello,
I'm looking for an asc file that will allow me to plot curves from tube models. Does anyone know where to find one?
Thanks,
Marty
I'm looking for an asc file that will allow me to plot curves from tube models. Does anyone know where to find one?
Thanks,
Marty
Hi Marty,Hello,
I'm looking for an asc file that will allow me to plot curves from tube models. Does anyone know where to find one?
Thanks, Marty
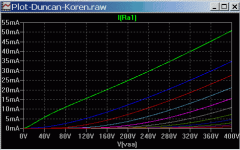
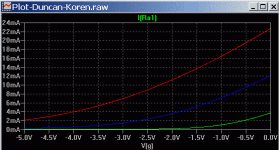
I have used this one to compare the Duncan and Koren triode models.
It's set to plot Koren ECC81 (a.k.a 12AT7). Click I(Ra2) for Duncan NH12AT7 plot (eg to compare the models). V1 can trim slight grid differences between two models due to different data sets. Click with the cursor over the grid to plot grid current.
Enter different model names as required. Notice the .Step param Vg List ... is set up and selected to suit the tubes Vg range (eg as per datasheet).
To plot Ia vs Vg stepping Va see the second demo for the changes.
Adding d(I(Ra1)) can plot transconductance.
Add more subcircuits as required.
Cheers,
Attachments
...
Adding d(I(Ra1)) can plot transconductance.
...
Thanks, I've been looking for a way to find the derivatives, didn't know it's built-in. 🙂
Looking at the photos, Mike might have been due for retirement anyway.
I have no idea of his age.
Saved the latest LTSpice bundle.
I did notice that the style of the changelog entries seemed to have changed recently
I have no idea of his age.
Saved the latest LTSpice bundle.
I did notice that the style of the changelog entries seemed to have changed recently
I've noticed updates can often be cranky (slow) as if the connection to the server is down to a few kbps. I've seen LT updates taking 30 minutes or more. This only started in the last few months and has happened across different installations so I know its not specific to one install.
Ive not noticed the Analog server to be slow. There were a couple of updates that pushed a lot of small test jig files, which too ages to fetch one at a time.
I also saw many big .exe file updates with no explanation in the changelog to explain why
I also saw many big .exe file updates with no explanation in the changelog to explain why
I have used this one to compare the Duncan and Koren triode models....
Thanks Ian,
That's just what I was looking for.
Marty
I've noticed updates can often be cranky (slow) as if the connection to the server is down to a few kbps. I've seen LT updates taking 30 minutes or more. This only started in the last few months and has happened across different installations so I know its not specific to one install.
This might help:
GRC's | DNS Nameserver Performance Benchmark
- Home
- Design & Build
- Software Tools
- Installing and using LTspice IV (now including LTXVII), From beginner to advanced